
FIGURE
Figure 5
- ID
- ZDB-FIG-210810-87
- Publication
- Zhang et al., 2021 - Insulin-Mimic Components in Acer truncatum Leaves: Bio-Guided Isolation, Annual Variance Profiling and Regulating Pathway Investigated by Omics
- Other Figures
- All Figure Page
- Back to All Figure Page
Figure 5
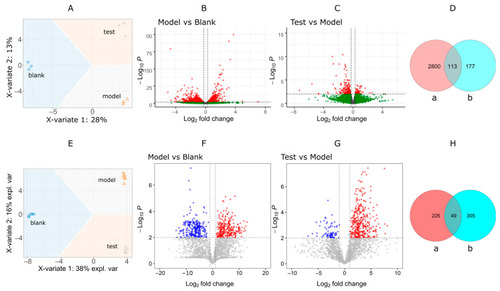
Visual analysis of differentially expressed genes (DEGs) and differential metabolites (DMs). (A) sPLS-DA analysis of DEGs. (B,C) valcono plot of DEGs (p < 0.01). (D) Venn plots of DEG counts. a, model vs. blank; b, test vs. model. (E) sPLS-DA analysis of DMs. (F,G) valcono plot of DMs (FC > 2, p < 0.01). (H) Venn plots of DM counts. a, model vs. blank; b, test vs. model. |
Expression Data
Expression Detail
Antibody Labeling
Phenotype Data
Phenotype Detail
Acknowledgments
This image is the copyrighted work of the attributed author or publisher, and
ZFIN has permission only to display this image to its users.
Additional permissions should be obtained from the applicable author or publisher of the image.
Full text @ Pharmaceuticals (Basel)