
FIGURE
Figure 1
- ID
- ZDB-FIG-210810-83
- Publication
- Zhang et al., 2021 - Insulin-Mimic Components in Acer truncatum Leaves: Bio-Guided Isolation, Annual Variance Profiling and Regulating Pathway Investigated by Omics
- Other Figures
- All Figure Page
- Back to All Figure Page
Figure 1
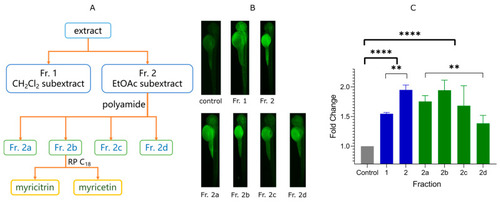
Bio-guided separation of the active components from Acer truncatum leaves. (A) Flow chart of bio-guided separation. (B) Fluorescent microscopy images after treatment of separated fractions. (C) Fold change of 2-NBDG fluorescence measured by ImageJ (** p < 0.01; **** p < 0.0001). The fold changes were calculated from the mean of the blank control. Green and blue are two different batches. The higher fold change indicates the better promotion of glucose uptake. |
Expression Data
Expression Detail
Antibody Labeling
Phenotype Data
Phenotype Detail
Acknowledgments
This image is the copyrighted work of the attributed author or publisher, and
ZFIN has permission only to display this image to its users.
Additional permissions should be obtained from the applicable author or publisher of the image.
Full text @ Pharmaceuticals (Basel)