
FIGURE
Figure 2
- ID
- ZDB-FIG-210810-84
- Publication
- Zhang et al., 2021 - Insulin-Mimic Components in Acer truncatum Leaves: Bio-Guided Isolation, Annual Variance Profiling and Regulating Pathway Investigated by Omics
- Other Figures
- All Figure Page
- Back to All Figure Page
Figure 2
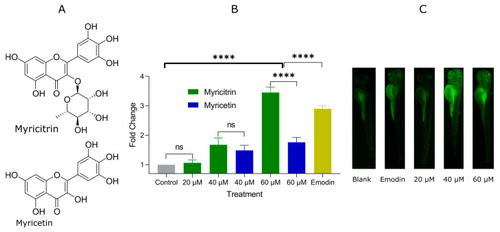
Myricitrin and myricetin-induced 2-NBDG uptake. (A) Chemical structures of myricitrin and myricetin. The structures were identified on the basis of HR MS/MS (Figure S2) and NMR spectra (Figure S3). (B) Fold change of 2-NBDG fluorescence measured by ImageJ (**** p < 0.001, ns, no statistical difference). The higher fold change indicates the better promotion of glucose uptake. (C) Fluorescent microscopy images after treatment of myricitrin and emodin. |
Expression Data
Expression Detail
Antibody Labeling
Phenotype Data
Phenotype Detail
Acknowledgments
This image is the copyrighted work of the attributed author or publisher, and
ZFIN has permission only to display this image to its users.
Additional permissions should be obtained from the applicable author or publisher of the image.
Full text @ Pharmaceuticals (Basel)