
Figure 4
- ID
- ZDB-FIG-210810-59
- Publication
- Madakashira et al., 2021 - Nuclear Organization during Hepatogenesis in Zebrafish Requires Uhrf1
- Other Figures
- All Figure Page
- Back to All Figure Page
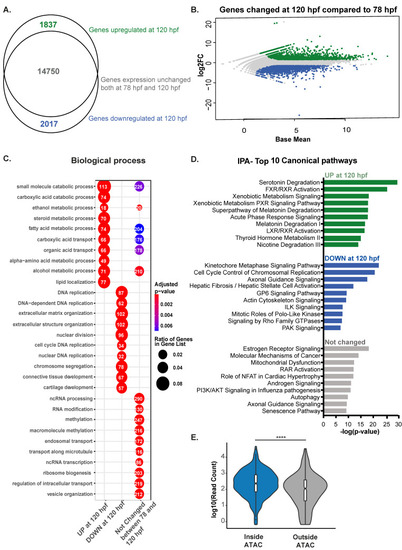
Expression of genes involved in signaling pathways enriched during early hepatic outgrowth. (A). RNA-Seq comparative analysis on differential expression of 120 hpf zebrafish livers compared to 78 hpf livers classified as expressed based on log2FC > 1.5 and padj < 0.05 represented by Venn diagram showing that most genes are already expressed at 78 hpf. (B). MA plot showing log2 fold change of genes at 120 hpf calculated on 78 hpf WT livers and Base Mean. In green upregulated genes (padj < 0.05 and log2FC > 1.5), in blue downregulate genes (padj < 0.05 and log2 Fold Change <−1.5) and in grey all other genes. (C). Gene Ontology of Biological Processes for genes categorized in B, with the 10 most significant terms for each group plotted. Numbers in each circle represent the number of genes of each GO term that are captured in the dataset plotted. (D). IPA of top 10 canonical pathways enriched for each group. (E). Violin plot displaying expression values of genes contained in open regions (inside ATAC) and in closed regions (outside ATAC) indicates that genes present in open regions are more expressed than genes not covered by ATAC-seq. **** indicates p-value < 0.0001 measured by unpaired t-test. |