
Figure 1
- ID
- ZDB-FIG-210810-56
- Publication
- Madakashira et al., 2021 - Nuclear Organization during Hepatogenesis in Zebrafish Requires Uhrf1
- Other Figures
- All Figure Page
- Back to All Figure Page
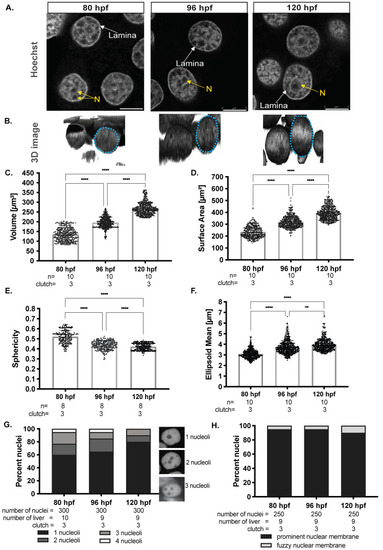
Hepatocyte nuclei increase in size, become elliptical and reduce nucleoli number during hepatic outgrowth. (A). Representative confocal images of Hoechst-stained hepatocytes from larvae at 80, 96, and 120 hpf. Regions depleted of Hoechst staining represent euchromatic regions, strong Hoechst foci represent heterochromatin. Yellow N indicates nucleolus; White arrows point to examples of the prominent nuclear lamina. Scale bar: 5 μm (B). 3D reconstructions of Z-stacks of Hoechst-stained hepatocyte nuclei at 80, 96, and 120 hpf display changes in size and shape as the embryo ages. Morphological measurements obtained from hepatocyte nuclei were analyzed using Las-X software for volume (C), surface area (D), sphericity (E), and ellipsoid mean (F). Each dot on the graph represents an individual nucleus, and the horizontal represents the median Hepatocyte nuclei were scored for the number of nucleoli per hepatocyte (G) and the presence of normal nuclear lamina observed as a rim around the nucleus by Hoechst staining (H). All measurements except sphericity were obtained by automated measurements in LasX software, while the sphericity was calculated based on surface area and volume measurements. All analyses were performed on larvae from 3 clutches, with minimum of 3 livers analyzed per clutch. ** p < 0.005, **** p < 0.00005. L–nuclear lamina, N-nucleoli. Magnification: 63×, 4× zoom, Scale bar: 5 μm. |