FIGURE

FIGURE 4

ID
ZDB-FIG-210807-4
Publication
Li et al., 2021 - An Inhibitor of NF-κB and an Agonist of AMPK: Network Prediction and Multi-Omics Integration to Derive Signaling Pathways for Acteoside Against Alzheimer's Disease
Other Figures
All Figure Page
Back to All Figure Page
FIGURE 4

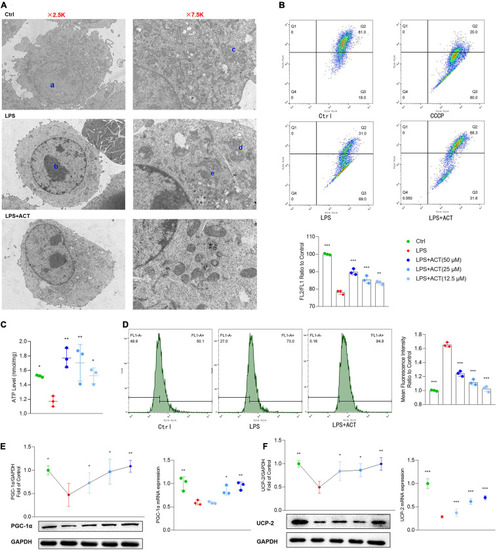
Effects of ACT on mitochondrial function in LPS-treated BV-2 cells. (A) Ultrastructural changes in the different groups of BV-2 cells under the transmission electron microscopy. a, normal nucleus. b, nucleus chromatin condensation. c, normal mitochondria. d, mitochondrial cristae disarranged or even disappeared. e, swollen and vacuolated mitochondria. (B) The representative images and bar graph of JC-1 red and green fluorescence ratio. (C) Bar graph showing quantified statistics of ATP level. (D) The representative images of DCFH-DA staining and bar graph of intracellular ROS production. (E) ACT distinctly decreases the protein and mRNA levels of PGC-1α. (F) ACT distinctly decreases the protein and mRNA levels of UCP-2. *P < 0.05, **P < 0.01, ***P < 0.005, versus the LPS group. n = 3.

Expression Data

Expression Detail
Antibody Labeling
Phenotype Data

Phenotype Detail
Acknowledgments
This image is the copyrighted work of the attributed author or publisher, and ZFIN has permission only to display this image to its users. Additional permissions should be obtained from the applicable author or publisher of the image. Full text @ Front Cell Dev Biol