FIGURE

FIGURE 9

ID
ZDB-FIG-210718-40
Publication
Hsiao et al., 2021 - The Incoherent Fluctuation of Folate Pools and Differential Regulation of Folate Enzymes Prioritize Nucleotide Supply in the Zebrafish Model Displaying Folate Deficiency-Induced Microphthalmia and Visual Defects
Other Figures
All Figure Page
Back to All Figure Page
FIGURE 9

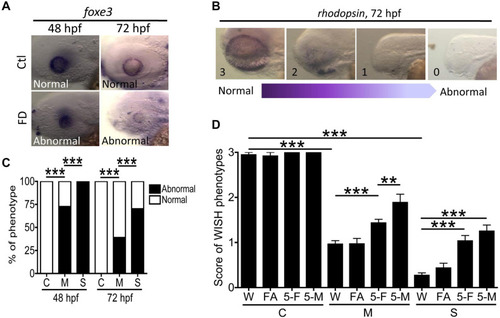
Analysis of ocular cell differentiation in FD larvae and response to folate derivatives. (A,C) Control and FD larvae at 48 and 72 hpf were characterized with WISH for the spatial distribution of foxe3 (ocular lens marker) and quantified for the percentage of larvae displaying abnormal expression patterns. (B,D) The aberrant distribution of rhodopsin observed in the eyes of FD larvae revealed by WISH at 3 dpf were categorized into four scoring categories, based on the severity of anomalies displayed, with “3” to be normal and “1” to be complete lack of signal. The severity of abnormality was quantified by the averaged score of an anomaly for each larva observed for each experimental group, including those with/without folate supplementation. Data were obtained from at least three independent trials with the total sample numbers ranging from 7 to 80 for each group. C, control; M, mild folate deficiency; S, severe folate deficiency; FA, folic acid; 5-F, 5-CHO-THF; 5-M, 5-CH3-THF. Statistical data are shown in percentage of a group for (C) and mean ± SEM for (D). ***p < 0.001; **p < 0.01.

Expression Data
Genes:
Fish:
Conditions:
Anatomical Terms:
Stage Range: Long-pec to Protruding-mouth

Expression Detail
Antibody Labeling
Phenotype Data
Fish:
Conditions:
Observed In:
Stage Range: Long-pec to Protruding-mouth

Phenotype Detail
Acknowledgments
This image is the copyrighted work of the attributed author or publisher, and ZFIN has permission only to display this image to its users. Additional permissions should be obtained from the applicable author or publisher of the image. Full text @ Front Cell Dev Biol