FIGURE

FIGURE 1

ID
ZDB-FIG-210718-28
Publication
Shimizu et al., 2021 - Differential Regenerative Capacity of the Optic Tectum of Adult Medaka and Zebrafish
Other Figures
All Figure Page
Back to All Figure Page
FIGURE 1

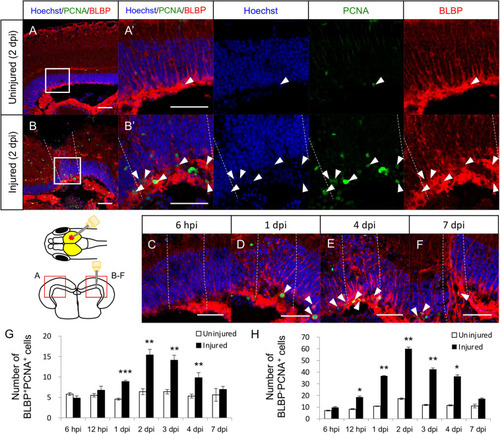
Proliferation of radial glia (RG) is increased in response to stab wound injury. Representative images of proliferative RG (BLBP+PCNA+ cells) in the uninjured (A) and injured (B) hemispheres at 2 days post injury (dpi). (A’,B’) Magnified images of the boxed area in (A,B). (C–F) Representative images of proliferative RG in the injured hemisphere at 6 h post injury (hpi) and at 1, 4, and 7 dpi. White arrowheads indicate BLBP+PCNA+ cells, and dashed lines indicate injured areas. Scale bar: 50 μm in (A–F) and (A’,B’). Schematic drawing of the stab injury in the right hemisphere of the optic tectum and cross-section. (G) Quantification of proliferative RG in both uninjured and injured hemispheres at 6 (n = 5) and 12 (n = 3) hpi, and 1 (n = 5), 2 (n = 5), 3 (n = 4), 4 (n = 5), and 7 (n = 4) dpi. (H) Quantification of proliferative cells (BLBPPCNA+ cells) except NE in both uninjured and injured hemispheres at 6 (n = 5) and 12 (n = 3) hpi, and 1 (n = 5), 2 (n = 5), 3 (n = 4), 4 (n = 5), and 7 (n = 4) dpi. Statistical analyses between uninjured and injured hemispheres at each time point were evaluated using paired Student’s t-tests. Statistical significance was defined as *P < 0.05; **P < 0.01; ***P < 0.001.

Expression Data

Expression Detail
Antibody Labeling
Phenotype Data

Phenotype Detail
Acknowledgments
This image is the copyrighted work of the attributed author or publisher, and ZFIN has permission only to display this image to its users. Additional permissions should be obtained from the applicable author or publisher of the image. Full text @ Front Cell Dev Biol