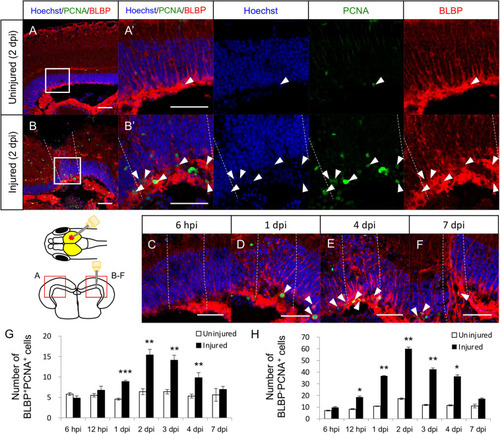
Proliferation of radial glia (RG) is increased in response to stab wound injury. Representative images of proliferative RG (BLBP+PCNA+ cells) in the uninjured (A) and injured (B) hemispheres at 2 days post injury (dpi). (A’,B’) Magnified images of the boxed area in (A,B). (C–F) Representative images of proliferative RG in the injured hemisphere at 6 h post injury (hpi) and at 1, 4, and 7 dpi. White arrowheads indicate BLBP+PCNA+ cells, and dashed lines indicate injured areas. Scale bar: 50 μm in (A–F) and (A’,B’). Schematic drawing of the stab injury in the right hemisphere of the optic tectum and cross-section. (G) Quantification of proliferative RG in both uninjured and injured hemispheres at 6 (n = 5) and 12 (n = 3) hpi, and 1 (n = 5), 2 (n = 5), 3 (n = 4), 4 (n = 5), and 7 (n = 4) dpi. (H) Quantification of proliferative cells (BLBPPCNA+ cells) except NE in both uninjured and injured hemispheres at 6 (n = 5) and 12 (n = 3) hpi, and 1 (n = 5), 2 (n = 5), 3 (n = 4), 4 (n = 5), and 7 (n = 4) dpi. Statistical analyses between uninjured and injured hemispheres at each time point were evaluated using paired Student’s t-tests. Statistical significance was defined as *P < 0.05; **P < 0.01; ***P < 0.001.

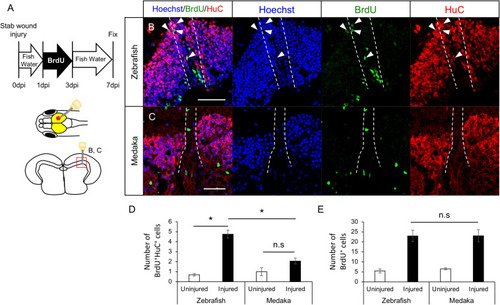
Generation of newborn neurons in the injured medaka is limited compared with zebrafish. (A) Schematic drawing of bromodeoxyuridine (BrdU)-labeling and stab injury in the right hemisphere of the optic tectum. Representative images of newborn neurons (BrdU+HuC+ cells) in both injured zebrafish (B) and medaka (C). White arrowheads indicate BrdU+HuC+ cells, and dashed lines indicate the injured areas. Scale bar: 50 μm. (D) Quantification of BrdU+HuC+ cells in the uninjured and injured hemispheres in zebrafish (n = 4) and medaka (n = 4). (E) Quantification of total BrdU+ cells in both uninjured and injured zebrafish (n = 4) and medaka (n = 4). Statistical analyses were evaluated using one-way analysis of variance followed by Tukey’s post hoc test. Statistical significance was defined as *P < 0.05.

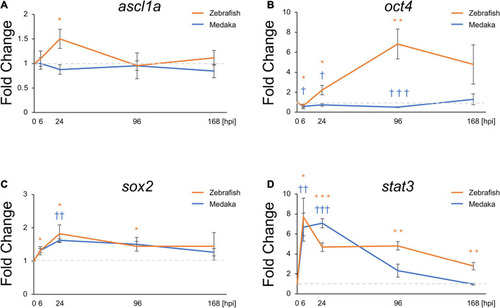
Pro-regenerative transcriptional factors are differentially expressed between the injured medaka and zebrafish. Quantitative polymerase chain reaction analysis of the pro-regenerative transcriptional factors ascl1a (A), oct4 (B), sox2 (C), and stat3 (D). Graphs indicate the relative gene expression in the injured tectum from 6 to 168 h post injury (hpi) compared to the uninjured tectum (n = 4). Statistical analyses between the uninjured and injured hemispheres at each time point were evaluated by unpaired Student’s t-tests. We used * for zebrafish and for medaka to indicate significant difference. Statistical significance was defined as * and P < 0.05; ** and ††P < 0.01; *** and †††P < 0.001.

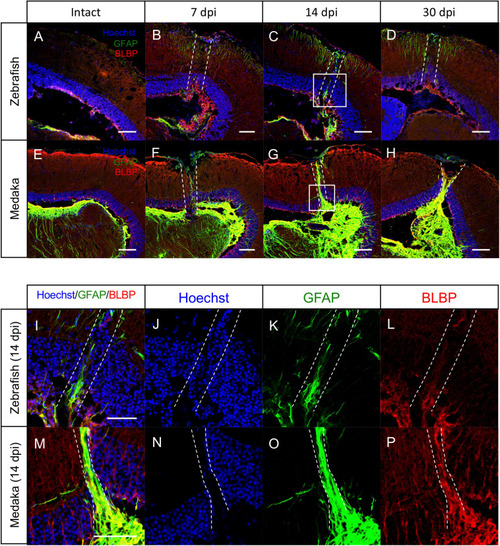
Persistent glial scar-like structure is observed in the injured medaka tectum. (A–H) Representative images of immunostaining with anti-GFAP and anti-BLBP antibodies on the uninjured (A: zebrafish and B: medaka) and injured hemisphere at 7, 14, and 30 days post injury (dpi) [(B–D): zebrafish and (E–H): medaka]. (I–P) Magnified images of the boxed area at 14 dpi [(I–L): zebrafish and (M–P): medaka]. The dashed lines indicate the injured areas. Scale bar: 100 (A–H) and 50 (I,M) μm.

Acknowledgments
This image is the copyrighted work of the attributed author or publisher, and ZFIN has permission only to display this image to its users. Additional permissions should be obtained from the applicable author or publisher of the image. Full text @ Front Cell Dev Biol