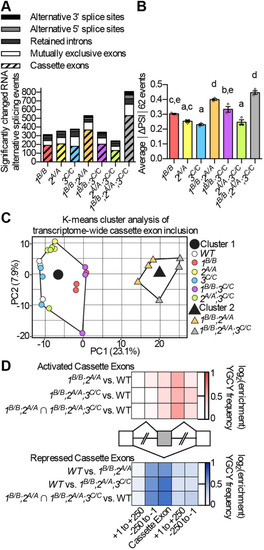
Zebrafish mbnl mutations led to widespread changes in adult skeletal muscle RNA alternative splicing. (A) Total number of RNA alternative splicing events of different types that were significantly misregulated between WT and mbnl mutant adult skeletal muscle, as identified by RNA-Seq. (B) The average absolute value of the change in percentage spliced in (ΔPSI) is shown for the set of 62 cassette exons for which inclusion was significantly misregulated in RNA-Seq analysis of the skeletal muscle of at least four of seven mbnl mutant fish lines compared to WT. (C) K-means cluster analysis based on changes in cassette exon inclusion showing that 1B/B;2A/A and 1B/B;2A/A;3C/C mutants cluster closely with each other, while other mutants cluster more closely with WT. Each small circle or triangle represents an individual fish, and the large circle and triangle represent the centers of the clusters. (D) Heat maps showing the enrichment of the previously identified Mbnl protein-binding sequence YGCY (where Y is a pyrimidine) within significantly misregulated cassette exons, in the intronic sequences 250 bp immediately upstream and downstream of those exons, and in the 250 bp of intronic sequences immediately adjacent to the flanking constitutive exons. Activated cassette exons are those in which Mbnl proteins regulated inclusion positively, and repressed cassette exons are those for which inclusion is decreased by Mbnl proteins. The YGCY enrichment analysis was performed for the set of cassette exons that were significantly misregulated in 1B/B;2A/A fish, in 1B/B;2A/A;3C/C fish, and for the set of misregulated exons that overlapped between the two (1B/B;2A/A∩1B/B;2A/A;3C/C). In A-D, the mbnl1 mutant allele is denoted as1B, the mbnl2 allele as 2A and the mbnl3 allele as 3C. In B, each dot represents one fish. Data are presented as mean±s.e.m. Data were analyzed by ordinary one-way ANOVA with Tukey's multiple comparisons test. Data bars that do not share the same letter above them are significantly different from one another. Raw data and statistical analysis details are in Table S5.
|
