FIGURE SUMMARY
Title

Zebrafish mbnl mutants model physical and molecular phenotypes of myotonic dystrophy

Authors
Hinman, M.N., Richardson, J.I., Sockol, R.A., Aronson, E.D., Stednitz, S.J., Murray, K.N., Berglund, J.A., Guillemin, K.
Source
Full text @ Dis. Model. Mech.

Mutation of zebrafish mbnl genes resulted in decreased adult body size. (A) Primary molecular mechanism of the human genetic disorder myotonic dystrophy (DM). In unaffected individuals, free MBNL1, MBNL2 and MBNL3 proteins bind to target pre-mRNAs and regulate the inclusion of alternative exons in mRNAs. MBNL proteins suppress alternative exon inclusion in the example shown here, but they promote inclusion of other target alternative exons. In individuals with DM, MBNL proteins are sequestered by long CUG (DM1) or CCUG (DM2) repeat RNAs, which decreases their availability to bind to target pre-mRNAs and alters mRNA isoform production and downstream protein function. (B) Diagram of WT and mutant zebrafish mbnl1, mbnl2 and mbnl3 predicted coding sequences. mbnl1 mutant alleles are denoted as 1A and 1B, mbnl2 alleles as 2A, and mbnl3 alleles as 3A, 3B and 3C. Mutant sequences are shown in Table S2. (C) Standard length of young adult 60 days post-fertilization (dpf) WT and mbnl mutant zebrafish that were raised in the same tank. On the right are representative images of fish of each genotype taken at 76 dpf. Scale bar: 10 mm. (D,E) Standard length of 7 dpf WT and double mbnl mutant zebrafish (D) or clutchmates from an incross of 1+/B;2A/A;3C/C fish (E). In C-E, each dot represents one fish and data are presented as mean±s.d. Data were analyzed by ordinary one-way ANOVA with Tukey's multiple comparisons test. Data bars that do not share the same letter above them are significantly different from one another. Raw data and statistical analysis details are in Table S5.

Zebrafish mbnl mutants exhibited altered movement. (A) Example still image taken from video of swim tests. Software was used to track the center of mass of each fish in the X and Y directions over 5 min. (B) Representative traces of individual fish of each genotype taken during the swim tests. x- and y-axes are the same as in A. mbnl1 mutant alleles are denoted as 1A and 1B, mbnl2 alleles as 2A, and mbnl3 alleles as 3A, 3B and 3C. (C-E) Total distance that adult WT and single (C), double (D) and triple (E) homozygous mbnl mutant fish swam during a 5-min swim test. (F-H) Percentage time actively swimming during the 5-min swim test for single (F), double (G) and triple (H) homozygous mbnl mutant fish. Pauses in swimming were removed from the data set, defined as at least 20 consecutive frames (2 s total) with no speed measurement greater than 1.5 cm/s. (I-K) Speed in cm/s during periods of active swimming during the 5-min swim test for single (I), double (J) and triple (K) homozygous mbnl mutant fish. (L-N) Fastest speed in cm/s, defined as the fastest 100 consecutive frames (10 s total) during the 5-min swim test, for single (L), double (M) and triple (N) homozygous mbnl mutant fish. (O-Q) Average relative distance from the bottom of the tank of fish during the 5-min swim test for single (O), double (P) and triple (Q) homozygous mbnl mutant fish. Zero represents the bottom of the tank and 100 represents the top of the tank. In C-Q, each dot represents one fish and data are presented as mean±s.e.m. In C,D,F,G,I,J,L,M,O,P, data were analyzed by ordinary one-way ANOVA with Tukey's multiple comparisons test; in E,H,K,N,Q, data were analyzed by an unpaired Student's t-test. Data bars that do not share the same letter above them are significantly different from one another. Raw data and statistical analysis details are in Table S5.

Alternative splicing of mbnl1 exon 5 was misregulated across tissues in zebrafish mbnl mutants. (A-F) RT-PCR analysis showing percentage spliced in (PSI) of mbnl1 exon 5 in WT and mbnl mutant whole 5 dpf larvae (A) and in adult skeletal muscle (B), heart (C), brain (D), cornea (E) and intestine (F). mbnl1 mutant alleles are denoted as 1A and 1B, mbnl2 alleles as 2A, and mbnl3 alleles as 3A, 3B and 3C. Representative RT-PCR gels are shown above each graph with band sizes in bp on the left. White boxes represent constitutive exons and gray boxes represent alternative exons. Dividing lines indicate samples run on separate gels. MBNL1 exon 5 inclusion is increased in human DM1 patients and other DM models (Gates et al., 2011; Terenzi and Ladd, 2010; Tran et al., 2011). In A-F, each dot represents RNA from one adult fish or a pool of five larval fish. Data are presented as mean±s.e.m. Data were analyzed by ordinary one-way ANOVA with Tukey's multiple comparisons test. Data bars that do not share the same letter above them are significantly different from one another. Raw data and statistical analysis details are in Table S5.

Zebrafish mbnl mutations led to widespread changes in adult skeletal muscle RNA alternative splicing. (A) Total number of RNA alternative splicing events of different types that were significantly misregulated between WT and mbnl mutant adult skeletal muscle, as identified by RNA-Seq. (B) The average absolute value of the change in percentage spliced in (ΔPSI) is shown for the set of 62 cassette exons for which inclusion was significantly misregulated in RNA-Seq analysis of the skeletal muscle of at least four of seven mbnl mutant fish lines compared to WT. (C) K-means cluster analysis based on changes in cassette exon inclusion showing that 1B/B;2A/A and 1B/B;2A/A;3C/C mutants cluster closely with each other, while other mutants cluster more closely with WT. Each small circle or triangle represents an individual fish, and the large circle and triangle represent the centers of the clusters. (D) Heat maps showing the enrichment of the previously identified Mbnl protein-binding sequence YGCY (where Y is a pyrimidine) within significantly misregulated cassette exons, in the intronic sequences 250 bp immediately upstream and downstream of those exons, and in the 250 bp of intronic sequences immediately adjacent to the flanking constitutive exons. Activated cassette exons are those in which Mbnl proteins regulated inclusion positively, and repressed cassette exons are those for which inclusion is decreased by Mbnl proteins. The YGCY enrichment analysis was performed for the set of cassette exons that were significantly misregulated in 1B/B;2A/A fish, in 1B/B;2A/A;3C/C fish, and for the set of misregulated exons that overlapped between the two (1B/B;2A/A1B/B;2A/A;3C/C). In A-D, the mbnl1 mutant allele is denoted as1B, the mbnl2 allele as 2A and the mbnl3 allele as 3C. In B, each dot represents one fish. Data are presented as mean±s.e.m. Data were analyzed by ordinary one-way ANOVA with Tukey's multiple comparisons test. Data bars that do not share the same letter above them are significantly different from one another. Raw data and statistical analysis details are in Table S5.

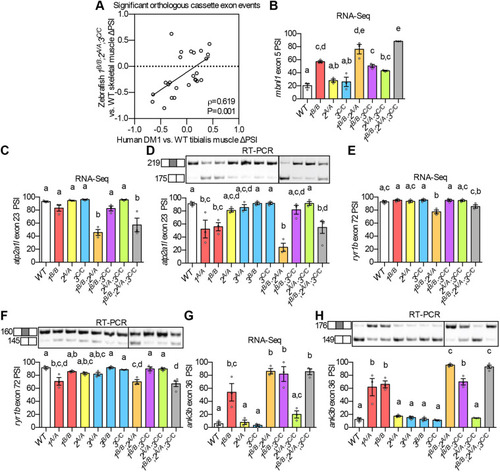
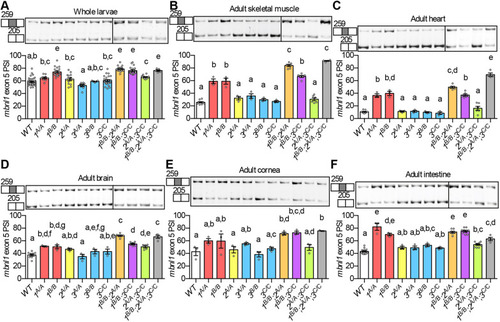
(A) ΔPSI between mutant and WT are shown for orthologous exons in zebrafish 1B/B;2,sup>A/A;3C/C skeletal muscle and in tibialis muscle from human DM1 patients. (B-H) RNA-Seq (B,C,E,G) and RT-PCR (D,F,H) analyses showing PSI of mbnl1 exon 5 (B), atp2a1l exon 23 (C,D), ryr1b exon 72 (E,F), and ank3b exon 36 (G,H) in WT and mbnl mutant adult zebrafish skeletal muscle. Orthologous human exon inclusion in DM patients is increased for MBNL1 and ANK3, and decreased for ATP2A1 and RYR1 (Freyermuth et al., 2016; Gates et al., 2011; Kimura et al., 2005; Terenzi and Ladd, 2010; Tran et al., 2011; Zhao et al., 2015). In A-H, mbnl1 mutant alleles are denoted as 1A and 1B, mbnl2 alleles as 2A, and mbnl3 alleles as 3A, 3B and 3C. In A, ρ is the Spearman's rank correlation coefficient. In B-H, data are presented as mean±s.e.m. Each dot represents RNA from one fish. Representative gels are shown above each RT-PCR graph with band sizes in bp shown on the left. White boxes represent constitutive exons and gray boxes represent alternative exons. Dividing lines indicate samples run on separate gels. Data were analyzed by ordinary one-way ANOVA with Tukey's multiple comparisons test. Data bars that do not share the same letter above them are significantly different from one another. Raw data and statistical analysis details are in Table S5.

Acknowledgments
This image is the copyrighted work of the attributed author or publisher, and ZFIN has permission only to display this image to its users. Additional permissions should be obtained from the applicable author or publisher of the image. Full text @ Dis. Model. Mech.