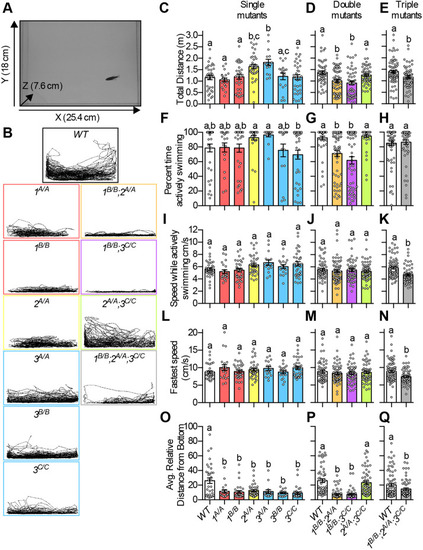
Zebrafish mbnl mutants exhibited altered movement. (A) Example still image taken from video of swim tests. Software was used to track the center of mass of each fish in the X and Y directions over 5 min. (B) Representative traces of individual fish of each genotype taken during the swim tests. x- and y-axes are the same as in A. mbnl1 mutant alleles are denoted as 1A and 1B, mbnl2 alleles as 2A, and mbnl3 alleles as 3A, 3B and 3C. (C-E) Total distance that adult WT and single (C), double (D) and triple (E) homozygous mbnl mutant fish swam during a 5-min swim test. (F-H) Percentage time actively swimming during the 5-min swim test for single (F), double (G) and triple (H) homozygous mbnl mutant fish. Pauses in swimming were removed from the data set, defined as at least 20 consecutive frames (2 s total) with no speed measurement greater than 1.5 cm/s. (I-K) Speed in cm/s during periods of active swimming during the 5-min swim test for single (I), double (J) and triple (K) homozygous mbnl mutant fish. (L-N) Fastest speed in cm/s, defined as the fastest 100 consecutive frames (10 s total) during the 5-min swim test, for single (L), double (M) and triple (N) homozygous mbnl mutant fish. (O-Q) Average relative distance from the bottom of the tank of fish during the 5-min swim test for single (O), double (P) and triple (Q) homozygous mbnl mutant fish. Zero represents the bottom of the tank and 100 represents the top of the tank. In C-Q, each dot represents one fish and data are presented as mean±s.e.m. In C,D,F,G,I,J,L,M,O,P, data were analyzed by ordinary one-way ANOVA with Tukey's multiple comparisons test; in E,H,K,N,Q, data were analyzed by an unpaired Student's t-test. Data bars that do not share the same letter above them are significantly different from one another. Raw data and statistical analysis details are in Table S5.
|
