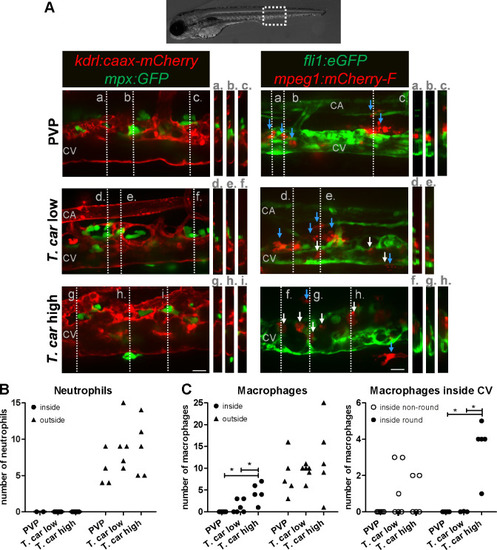
Tg(kdrl:caax-mCherry;mpx:GFP) and Tg(fli1:eGFP x mpeg1:mCherry-F) zebrafish larvae were injected intravenously at 5 dpf with n = 200 T. carassii or with PVP. At 4 dpi larvae were separated in high- and low-infected groups and imaged with a Roper Spinning Disk Confocal Microscope using ×40 magnification. Scale bars indicate 25 μm. CA: caudal artery; CV: caudal vein. (A) Left panel: representative images of the longitudinal view of the caudal vessels (red), capturing the location of neutrophils (green). Orthogonal views of the locations marked with grey dashed lines (a,b,c,d,e,f,g,h,i), confirm that in all groups, neutrophils are present exclusively outside the vessels. Right panel: representative images of the longitudinal view of the vessels, capturing the position of macrophages (red) outside the vessels (blue arrowheads) or inside (white arrowheads) the caudal vein (green). Orthogonal views of the locations marked with grey dashed lines (a,b,c,d,e,f,g,h) confirm that in PVP controls, macrophages are present exclusively outside the vessels (blue arrows); in low-infected larvae, most macrophages are outside the vessels (blue arrows) having an elongated or dendritic morphology, although seldomly macrophages can also be observed within the caudal vein (white arrows); in high-infected larvae, although macrophages with dendritic morphology can be seen outside the vessels, the majority of the macrophages resides inside the caudal vein, clearly having a rounded morphology. Video 4 provides the stacks used for the orthogonal views. (B–C) quantification of the number of neutrophils (B) and macrophages (C) (left panel) inside or outside the caudal vein; of the macrophages observed inside in (C), we quantified the number of those with a round or non-round morphology C (right panel). Symbols indicate individual larvae (n = 4–6 larvae per group, from two independent experiments). * indicates significant differences as assessed by One-Way ANOVA, followed by Tukey’s post-hoc test.
|
