|
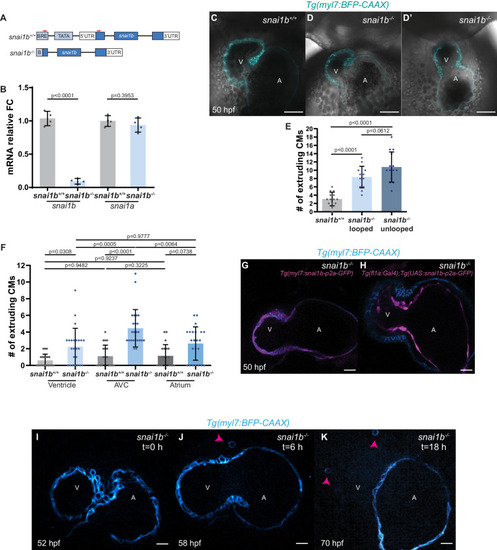
Generation of <italic toggle='yes'>snai1b</italic> mutants.(A) Schematic of the promoter-less snai1b allele. Two gRNAs (red lines) were used to generate a snai1b mutant allele lacking 1300 bp upstream of the start codon. (B) Relative mRNA levels of snai1b are significantly reduced in snai1b-/- hearts at 48 hpf, whereas snai1a expression levels appear unchanged, indicating lack of transcriptional adaptation by the paralogue; n = 4 biological replicates, 30 embryos each. (C–D’) Single-plane images of 50 hpf snai1b+/+ (C) and snai1b-/- (D–D’) hearts, with 50% of snai1b-/- hearts exhibiting cardiac looping defects (D’). (E) Unlooped and looped snai1b-/- hearts display a similar number of extruding CMs (snai1b+/+, n = 14; looped snai1b-/-, n = 14; unlooped snai1b-/-, n = 14). (F) A higher proportion of the extruding CMs in snai1b-/- hearts are located in the atrioventricular canal compared with the ventricle and atrium (snai1b+/+, n = 20; snai1b-/-, n = 24). (G, H) Single–plane images of 50 hpf snai1b-/- hearts overexpressing snai1b under a myl7 (G) or fli1a (H) promoter. (I, J) Frames from time-lapse imaging of the beating heart of a snai1b-/- embryo to visualize extruding cardiomyocytes (CMs) at 52 (I), 58 (J), and 70 (K) hpf; extruded CMs are found in the pericardial cavity (arrowheads in J and K). Plot values represent means ± S.D.; p-values determined by Student’s t-test (B) or by one-way ANOVA followed by multiple comparisons with Dunn test (E, F). Scale bars: 20 µm (C–D’, G–K). BRE: transcription factor IIB response element; V: ventricle; A: atrium; n: number of embryos; FC: fold change. All Ct values are listed in Supplementary file 2.
|