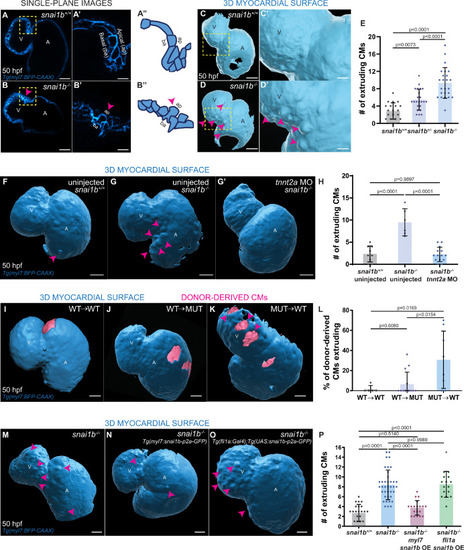
(A–B”) Single-plane images of Tg(myl7:BFP-CAAX) snai1b+/+ (A) and snai1b-/- (B) hearts at 50 hpf. Close-up of boxed areas (A’, B’) and schematic (A”, B”). (C–D’) 3D surface rendering of the myocardium of Tg(myl7:BFP-CAAX) snai1b+/+ (C, C’) and snai1b-/- (D, D’) embryos at 50 hpf. CM extrusions are clearly observed in snai1b-/- embryos (magenta arrowheads in B, B’, B”, D, D’). (E) More CMs are extruding in Tg(myl7:BFP-CAAX) snai1b-/- embryos compared with snai1b+/+ and snai1b+/- siblings at 50 hpf (snai1b+/+, n = 20; snai1b+/-, n = 23; snai1b-/-, n = 24). (F–H) Blocking cardiac contractions with tnnt2a MO leads to a reduced number of extruding CMs in snai1b-/- embryos, comparable with uninjected snai1b+/+ embryos. (F–G’) 3D surface rendering of the myocardium of snai1b+/+ (F) and snai1b-/- (G) uninjected embryos and snai1b-/- embryos injected with tnnt2a MO (G’). (H) Fewer CMs are extruding (magenta arrowheads in G) in snai1b-/- embryos injected with tnnt2a MO (n = 14) compared with uninjected snai1b-/- (n = 6) and snai1b+/+ (n = 9) embryos at 50 hpf. (I–L) 3D surface rendering of the myocardium showing snai1b+/+ donor-derived CMs in a snai1b+/+ (I) or snai1b-/- (J) heart, and snai1b-/- donor-derived CMs in a snai1b+/+ heart (K). (L) The percentage of donor-derived CMs that extrude is higher when snai1b-/- donor-derived CMs are in snai1b+/+ hearts (n = 8) than when snai1b+/+ donor-derived CMs are in snai1b+/+ (n = 5) or snai1b-/- (n = 14) hearts. (M–P) Overexpression of snai1b specifically in CMs partially rescues the CM extrusion phenotype in snai1b-/- embryos. 3D surface rendering of the myocardium of a snai1b-/- embryo (M), and snai1b-/- embryo overexpressing snai1b under a myl7 (N) or a fli1a (O) promoter. (P) Fewer CMs are extruding (magenta arrowheads) in snai1b-/- embryos (n = 19) overexpressing snai1b in CMs (N, P) compared with snai1b-/- embryos (M, P, n = 38), and this number is comparable to that in snai1+/+ embryos (n = 24). The number of extruding CMs does not change in snai1b-/- embryos (n = 16) when snai1b is overexpressed in endothelial cells (fli1a) (O, P). Plot values represent means ± S.D.; p-values determined by one-way ANOVA followed by multiple comparisons with Dunn test (E, H, L, P). Scale bars: 20 µm. V: ventricle; A: atrium; ap: apical; ba: basal; n: number of embryos.
|
