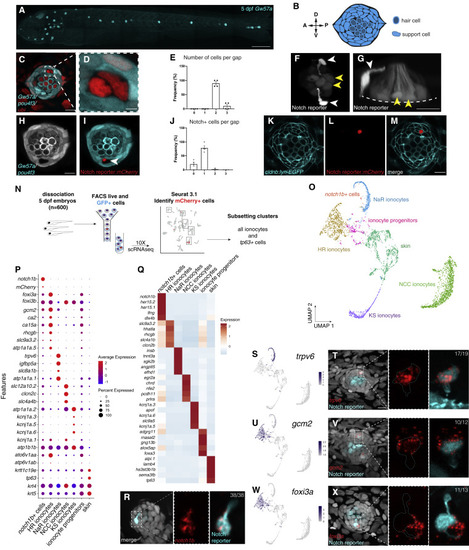
(A) Maximum projection of a 5 dpf Gw57a:EGFP;pou4f3:GFP larva. Scale bar, 300 μm. (B) Schematic of neuromast nuclei, dorsal view. (C) ubi:H2A-mCherry;Gw57a:EGFP;pou4f3:GFP larvae labeling nuclei, support cells and hair cells show a pair of cells that does not express neuromast or hair cell markers, dorsal view. (D) Magnification of (C). (E) Quantification of (C) (n = 4 fish, 36 neuromasts). p < 0.0001 (One-way ANOVA). Error bars = standard error of the mean (SEM). (F) The Notch reporter tp1bglobin:EGFP labels one cell of the pair (white arrowheads) and central support cells (yellow arrowheads). (G) 3D projection of a neuromast with a non-lateral line cell (white arrowhead) and central support cells (yellow arrowheads), lateral view (Video S1). (H and I) (H) Z slice of Gw57a:EGFP;pou4f3:GFP and (I) tp1bglobin:hmgb1:mCherry confirms the Notch+ cell is one of the cells in the gap of (C). (J) Quantification of Notch+ cells per gap (n = 4 fish, 16 gaps).p < 0.0001 (One-way ANOVA). Error bars = SEM. (K–M) cldnb:lyn-GFP;tp1bglobin:mCherry larvae label all neuromasts, skin cells (K), the Notch+ cell (L) and its partner cell. (N) scRNA-seq sorting strategy. (O) UMAP after subsetting ionocytes and tp63+ cells. (P) Dot plot of known ionocyte markers. (Q) Pseudobulk heatmap of cluster markers. (R) notch1b hybridization chain reaction (HCR). (S) Feature plot for trpv6. (T) HCR of trpv6 in the Notch+ cell (n = 6 fish, 12 neuromasts). n numbers = number of Nm ionocyte pairs analyzed. Magnification of the boxed area. (U) Feature plot for gcm2. (V) gcm2 is expressed in both cells in the pair (n = 4 fish, 11 neuromasts). (W) Feature plot of foxi3a. (X) foxi3a is expressed in the Notch− ionocyte (n = 5 fish, 12 neuromasts). All images, except (A) and (G) were blurred. (A), (F), and (G) were non-linear adjusted (gamma). Scale bars, 10 μm, unless otherwise noted. See also Figure S1 and Video S1.
|
