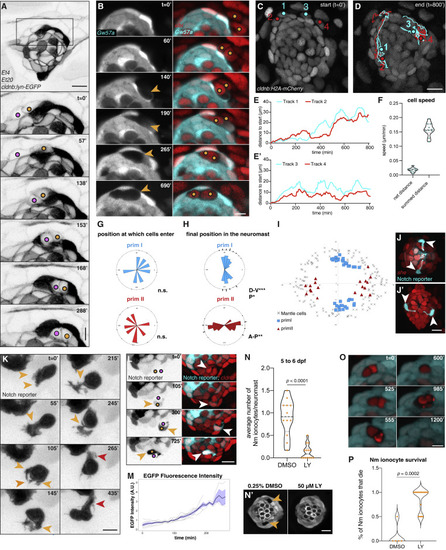
(A) Still images of a time-lapse recording of two Nm ionocyte precursors (colored dots) entering a 3 dpf Et4;Et20;cldnb-lynEGFP neuromast (Video S2). Magnification of boxed area is shown below. Scale bar, 5 μm, images were gamma adjusted. (B) Individual z slices of a time-lapse recording of a Gw57a:EGFP;ubi:H2A-mCherry larva at 3 dpf, with Nm ionocyte precursor cells migrating into the neuromast (right panels, colored dots), creating a gap in EGFP fluorescence (left panels, orange arrowheads, Video S3). Scale bar, 5 μm. (C and D) Tracks of two Nm ionocyte precursor cell pairs in a 2 dpf cldnb:H2A-mCherry larva (Video S4). Red and cyan dots depict the position of the Notch− and the Notch+ cell of each pair at the start (C) and end point of the movie (D). (E and E′) Quantification of the distance from the start position of the cells tracked in (C) and (D) over time. (F) Quantification of the cell speed calculated based on the net distance, as well as the summed distance that Notch+ cells traverse (n = 7 neuromasts, 10 cells). (G) Rose plots displaying the angular position at which Nm ionocyte precursors enter neuromasts of different polarities (primI- and primII, blue and red labeling, respectively) (n = 15 neuromasts, 7 fish). Binomial test revealed no directional bias. (H and I) Angular, final position of Nm ionocytes in primI- and primII-derived 5 dpf neuromasts (H), and their spatial distribution in relation to mantle cell position (I) (n = 55 neuromasts). Binomial analysis showed significant bipolar localization (p < 0.0001) with a slight directional bias toward posterior in primI-derived neuromasts (p = 0.004). (J and J′) Nm ionocyte localization in primI-derived (J) and primII-derived neuromasts at 5 dpf (J′). Images were gamma adjusted. (K) Still images of a time-lapse recording at 3 dpf, depicting protrusions of a Notch+ Nm ionocyte precursor (orange arrowheads) before stabilizing an apical extension (red arrowheads, Video S5). Images were gamma adjusted. Scale bar, 5 μm. (L) Gradual increase in Notch reporter fluorescence (left panel, orange arrowheads; right panel, white arrowheads) as Nm ionocyte precursor cells (left panel, colored dots) re-arrange between neuromast cells (Video S6). (M) Quantification of Notch reporter GFP fluorescence over time, normalized by the average of all the curves up to the 160 min time point. (N–N″) Nm ionocyte frequency (shown as gaps in Gw57a:EGFP;pou4f3:GFP, orange arrowheads) following inhibition of Notch signaling with 50 μM LY411575 for 24 h (n = 14 larvae, 84 neuromasts) between 5 and 6 dpf compared with DMSO controls (n = 12 larvae, 72 neuromasts; Mann-Whitney test, p < 0.0001). (O) Still images of time lapse from a 4 dpf larva (Gw57a:EGFP; ubi:H2A-mCherry) show a pair of Nm ionocyte undergoing cell death after Notch inhibition. (P) Quantification of time lapses assessing Nm ionocyte death after incubation with 50-μM LY411575 (n = 8 larvae, 18 neuromasts) compared with DMSO controls (n = 3 larvae, 5 neuromasts). Scale bars, 10 μm, unless otherwise noted. Dashed black lines in violin plots indicate the median, while dotted black lines indicate quartiles. See also Figure S3 and Videos S2, S3, S4, S5, S6, S7, and S8.
|
