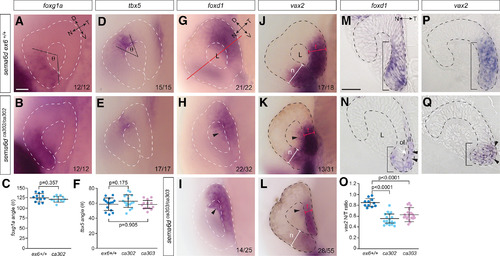
sema6d mutants display temporal neural retina defects post optic cup morphogenesis. A, B, D, E, Lateral images of 24-hpf optic cups processed for RNA ISH in wild-type (A, D) and sema6d mutant (B, E) embryos show similar expression of nasal (foxg1a) and dorsal (tbx5) markers. Of note, these domains derive from the dorsal and posterior eye vesicle, respectively. In the bottom right of panels are the number of embryos of the total analyzed that exhibited either a WT (A, B, D, E, G, J) or a disrupted (I,K,L) expression pattern. C, F, The angle formed by the lateral edges of the foxg1a (C; p values are unpaired t test, df = 22, error bars are SD) and tbx5 (F; p values are unpaired t test, df = 30 ex6+/+ vs ca302, df = 24 ex6+/+ vs ca303, error bars are SD) domains to the center of the lens (θ). G–L, foxd1 and vax2 RNA ISH viewed in whole mount. The shape and size of temporal eye (early ventral) markers, vax2 and foxd1, are disrupted in the sema6d302 (H, K) and sema6d303 (I, L) mutants as compared with wild-type siblings (G, J). Black arrowheads point to aberrant vax2 and foxd1 label in the inner vesicle leaflet, seen through the depth of the eye in the transparent zebrafish embryo. M, N, P, Q, Transverse plastic sections (axis shown by red line in G) through the central retina of 24-hpf wild-type sibling and sema6d mutant eyes processed for foxd1 and vax2 RNA ISH. Note in mutants a smaller (compare t in J–L and length of bars in M, P vs N, Q) foxd1/vax2 domain in the temporal neural retina, and an open ventricle as compared to wild-type (white arrow in N). O, Blinded quantitation of the ratio of the width of vax2+ domain in temporal versus nasal optic cup (t and n in J–L), which captures the redistribution of vax2 expression in sema6d mutants (p values are one-way ANOVA, Dunnett’s multiple comparisons test, error bars are SD, df = 53). Scale bars: 50 μm (A, M). D: dorsal, il: inner leaflet, L: lens, N: nasal, ol: outer leaflet, T: temporal, V: ventral.
|
