
Fig. 6
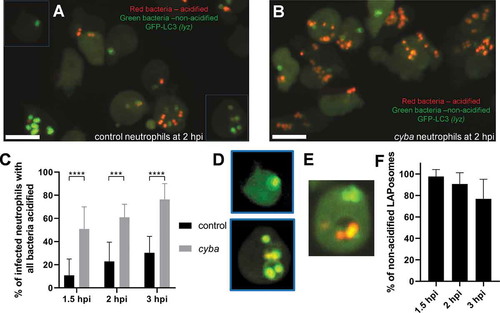
Loss of Cyba leads to increased acidification of neutrophil-ingested S. aureus. (A and B) Confocal photomicrographs shown as maximum intensity projections of the control (A) and cyba knockdown (B) live lyz:RFP-GFP-Lc3 embryos infected with approximately 1500 CFU of S. aureus stained with pHrodo Red and Fluorescein pH-indicating dyes. Green bacteria indicate that they are localized in neutral pH, whereas red bacteria are acidified. Scale bars: 10 µm. (C) Quantification of acidification rates at 1.5, 2, and 3 hpi of intracellular S. aureus within control and cyba knockdown neutrophils of live lyz:RFP-GFP-Lc3 embryos infected with approximately 1500 CFU of S. aureus. Data are shown as mean ± standard (SD) obtained from three independent experiments (6 larvae per group). For 1.5 hpi, 170 infected neutrophils in 18 control larvae, and 168 infected neutrophils in 18 larvae were analyzed. For 2 hpi, 188 infected neutrophils in 18 control larvae and 214 infected neutrophils in 18 cyba larvae were analyzed. For 3 hpi, 154 infected neutrophils in 18 control larvae and 204 neutrophils in 18 cyba larvae were analyzed. Two-way ANOVA with Bonferroni’s posttest was used. *** P < 0.001, **** P < 0.0001. (D) Examples of control neutrophils (indicated in panel a) with LAPosomes containing non-acidified S. aureus at 2 hpi. Contrast was enhanced equally for both channels to visualize LAPosomes. (E) A rare example of a control neutrophil with a LAPosome containing acidified S. aureus at 3 hpi. (F) Quantification of non-acidified LAPosomes within control neutrophils of live lyz:RFP-GFP-Lc3 embryos at 1.5, 2 and 3 hpi. For 1.5 hpi, 142 of LAPosomes were analyzed. For 2 hpi, 157 of LAPosomes were analyzed. For 3 hpi, 132 of LAPosomes were analyzed |