
Fig. 1
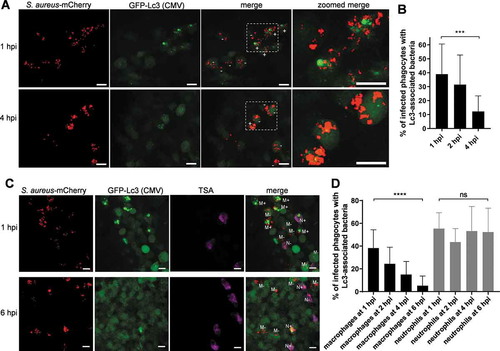
Different kinetics of the Lc3-mediated response in macrophages and neutrophils infected by S. aureus. (A) Confocal photomicrographs are shown as maximum intensity projections of fixed CMV:GFP-Lc3 embryos infected with approximately 1500 CFU of mCherry-labeled S. aureus at 1 (top panel) and 4 hpi (bottom panel). Phagocytes are seen containing bacteria with (+) or without (-) Lc3 aggregates. Images shown are representative of three independent experiments. Scale bars: 10 µm. (B) Quantification of Lc3 associations with intracellular S. aureus in fixed CMV:GFP-Lc3 embryos at 1, 2, and 4 hpi with approximately 1500 CFU. Data are shown as mean ± standard deviation (SD) obtained from three independent experiments (5–6 larvae per experiment per group). For 1 hpi, 175 infected phagocytes in 18 larvae were analyzed. For 2 hpi, 198 infected phagocytes in 17 larvae were analyzed. For 4 hpi, 204 infected phagocytes in 17 larvae were analyzed. One-way ANOVA with Bonferroni’s posttest was used. *** P < 0.001. (C) Confocal photomicrographs are shown as maximum intensity projections of fixed CMV:GFP-Lc3 transgenic embryos infected with approximately 1500 CFU of mCherry-labeled S. aureus. Embryos were fixed at 1 (top panel) and 6 hpi (bottom panel) and chemically stained for Mpx activity (TSA, magenta). TSA-negative macrophages are seen containing bacteria with (M+) or without (M-) Lc3 aggregates as well as TSA-positive neutrophils containing bacteria with (N+) and without Lc3 aggregates (N-). The images shown are representative of three independent experiments. Scale bars: 10 µm. (D) Quantification of Lc3 associations with intracellular S. aureus within macrophages (black bars) and neutrophils (gray bars) of fixed CMV:GFP-Lc3 transgenic embryos infected with approximately 1500 CFU of mCherry-labeled S. aureus at 1, 2, 4 and 6 hpi. Data are shown as mean ± standard deviation (SD) obtained from three independent experiments (5–6 larvae per experiment per group). For 1 hpi, 151 infected macrophages and 60 infected neutrophils in 18 larvae were analyzed. For 2, hpi 146 infected macrophages and 64 neutrophils in 18 larvae were analyzed. For 4 hpi, 159 infected macrophages and 56 neutrophils in 17 larvae were analyzed. For 6 hpi, 161 infected macrophages and 70 infected neutrophils in 18 larvae were analyzed. Two-way ANOVA with Bonferroni’s posttest was used. **** P < 0.0001, ns – not significant |