
Fig. 1
- ID
- ZDB-FIG-210510-25
- Publication
- Zhang et al., 2020 - Bone morphogenetic protein signaling regulates Id1-mediated neural stem cell quiescence in the adult zebrafish brain via a phylogenetically conserved enhancer module
- Other Figures
- All Figure Page
- Back to All Figure Page
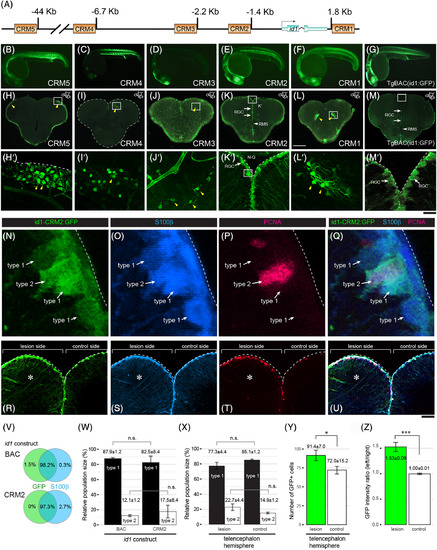
The id1 cis‐regulatory module 2 (CRM2) drives ventricular expression and responds with increased expression to stab injury of the adult zebrafish telencephalon. A, Homology‐based search for cis‐regulatory modules (CRMs). Schematic representation of the id1 locus with putative CRMs 1 to 5 highlighted by yellow rectangles. B‐M′, Stable GFP reporter expression of id1‐CRM5 (B and H‐H′), id1‐CRM4 (C and I‐I′), id1‐CRM3 (D and J‐J′), id1‐CRM2 (E and K–K′), id1‐CRM1 (F and L‐L′) are shown in comparison with the control TgBAC(id1:GFP) (G and M‐M′) for 24 hpf embryos (B‐G) and adult telencephala (H‐M′). H‐M, GFP reporter expression analyzed in transverse sections from the middle part of the adult telencephalon (location of section schematically indicated in the upper‐hand right corner). The Tg(id1‐CRM2:GFP) transgenic line (K) recapitulates GFP expression of the TgBAC(id1:GFP) line (M) with strong expression in the ventricular zone (white arrows) and absence of expression in the rostral migratory stream (RMS, white arrowheads). The yellow arrowheads indicate ectopic GFP expression in the tela choroidea (H‐H′), cells with appearances of neurons (I‐I′ and L‐L′) and oligodendrocytes (J‐J′). Rectangles (H‐M) represent the region magnified in H′‐M′, respectively. Dashed lines indicate the boundary of the telencephalon. N‐Q, Magnified views of RGCs highlighting type 1 and type 2 RGCs identified by expression of id1‐CRM2:GFP (N), S100ß (O) and PCNA (P; all merged in Q). R‐U, Transverse view of a 5 days postinjury telencephalon showing the expression of id1‐CRM2:GFP (R), S100ß (S) and PCNA (T; all merged in U). The lesion site (left hemisphere) is marked by an asterisk. V‐W, Summary of colocalization analysis of GFP and S100ß expression for BAC and CRM2‐ id1 constructs. W, Relative population sizes of type 1 and type 2 RGCs for BAC and id1‐CRM2 constructs. X, Y, Relative population sizes of type 1 and type 2 RGCs (X) and the number of GFP+ cells (Y) for id1‐CRM2 constructs, comparing lesioned and unlesioned control hemispheres. Z, id1‐CRM2:GFP intensity ratio between left and right hemispheres comparing undamaged telencephalon (control) and damaged telencephalon (lesion). Significance is indicated by asterisks: *.01 ≤ P < .05; ***P < .001. n.s. = not significant. Scale bars = 200 μm (H‐M), 20 μm (B‐G; H′‐M′), 2 μm (N‐Q), and 25 μm (R‐U) |