
- Title
-
Bone morphogenetic protein signaling regulates Id1-mediated neural stem cell quiescence in the adult zebrafish brain via a phylogenetically conserved enhancer module
- Authors
- Zhang, G., Ferg, M., Lübke, L., Takamiya, M., Beil, T., Gourain, V., Diotel, N., Strähle, U., Rastegar, S.
- Source
- Full text @ Stem Cells
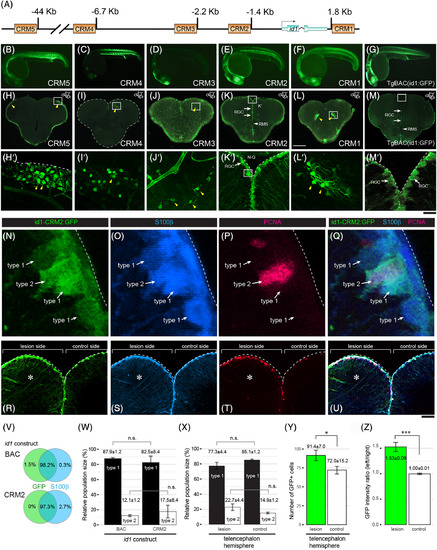
The id1 cis‐regulatory module 2 (CRM2) drives ventricular expression and responds with increased expression to stab injury of the adult zebrafish telencephalon. A, Homology‐based search for cis‐regulatory modules (CRMs). Schematic representation of the id1 locus with putative CRMs 1 to 5 highlighted by yellow rectangles. B‐M′, Stable GFP reporter expression of id1‐CRM5 (B and H‐H′), id1‐CRM4 (C and I‐I′), id1‐CRM3 (D and J‐J′), id1‐CRM2 (E and K–K′), id1‐CRM1 (F and L‐L′) are shown in comparison with the control TgBAC(id1:GFP) (G and M‐M′) for 24 hpf embryos (B‐G) and adult telencephala (H‐M′). H‐M, GFP reporter expression analyzed in transverse sections from the middle part of the adult telencephalon (location of section schematically indicated in the upper‐hand right corner). The Tg(id1‐CRM2:GFP) transgenic line (K) recapitulates GFP expression of the TgBAC(id1:GFP) line (M) with strong expression in the ventricular zone (white arrows) and absence of expression in the rostral migratory stream (RMS, white arrowheads). The yellow arrowheads indicate ectopic GFP expression in the tela choroidea (H‐H′), cells with appearances of neurons (I‐I′ and L‐L′) and oligodendrocytes (J‐J′). Rectangles (H‐M) represent the region magnified in H′‐M′, respectively. Dashed lines indicate the boundary of the telencephalon. N‐Q, Magnified views of RGCs highlighting type 1 and type 2 RGCs identified by expression of id1‐CRM2:GFP (N), S100ß (O) and PCNA (P; all merged in Q). R‐U, Transverse view of a 5 days postinjury telencephalon showing the expression of id1‐CRM2:GFP (R), S100ß (S) and PCNA (T; all merged in U). The lesion site (left hemisphere) is marked by an asterisk. V‐W, Summary of colocalization analysis of GFP and S100ß expression for BAC and CRM2‐ id1 constructs. W, Relative population sizes of type 1 and type 2 RGCs for BAC and id1‐CRM2 constructs. X, Y, Relative population sizes of type 1 and type 2 RGCs (X) and the number of GFP+ cells (Y) for id1‐CRM2 constructs, comparing lesioned and unlesioned control hemispheres. Z, id1‐CRM2:GFP intensity ratio between left and right hemispheres comparing undamaged telencephalon (control) and damaged telencephalon (lesion). Significance is indicated by asterisks: *.01 ≤ P < .05; ***P < .001. n.s. = not significant. Scale bars = 200 μm (H‐M), 20 μm (B‐G; H′‐M′), 2 μm (N‐Q), and 25 μm (R‐U) |
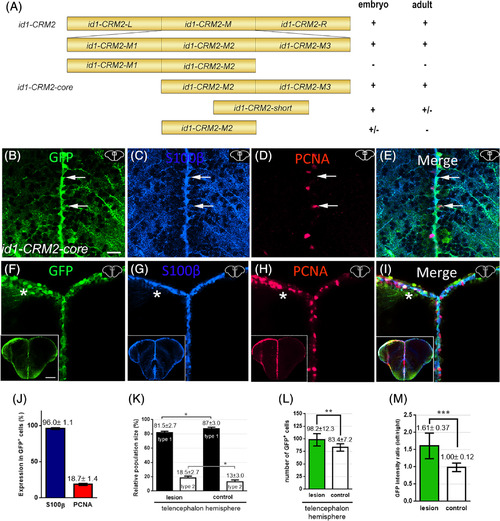
Deletion mapping of id1‐CRM2 identified a 157 bp core region, which confers RGC‐specific expression in the adult telencephalon. A, 5′and 3′ deletions of id1‐CRM2 analyzed for expression in zebrafish embryos and adult brains. Results are summarized on the right; + indicates specific GFP expression; ± and − represent weak and absence of expression, respectively. B‐I, Immunohistochemistry of telencephalic transverse sections with antibodies against GFP (B, F), S100ß (C, G), and PCNA (D, H) (merged panels: E, I). Section levels and areas of magnification are indicated in the upper right‐hand corner of each image. B‐E, White arrows show two RGCs. E, The upper cell is GFP+/S100β+/PCNA− (type 1 RGC), whereas the lower cell is GFP+/S100+/PCNA+ (type 2 RGC). F‐I, Upon stab wound injury the reporter construct expression is upregulated. The left injured side is labeled with a white asterisk. B‐I, Section levels and areas of magnification are indicated in the upper right‐hand corner each image. J, Quantification of PCNA and S100ß expression in id1‐CRM2:GFP‐positive cells. K, Relative population size of type 1 and type 2 RGCs in the control and lesioned hemisphere. L, M, Quantification of GFP‐positive cells and GFP intensity upon injury. Graphs showing the number of GFP‐expressing cells (L) and the intensity ratio between left uninjured (control) and right injured hemispheres respectively (M). Bars: mean ± SD. Significance is indicated by asterisks: *P < .05; **P < .01; ***P < .001. Boxed image in lower left‐hand corner of (F‐I) represents entire brain sections. n = 3 animals (B‐L), n = 15 sections (M). Scale bar = 20 μm (B‐I); 200 μm for Boxed image in lower left‐hand corner of (F‐I) |
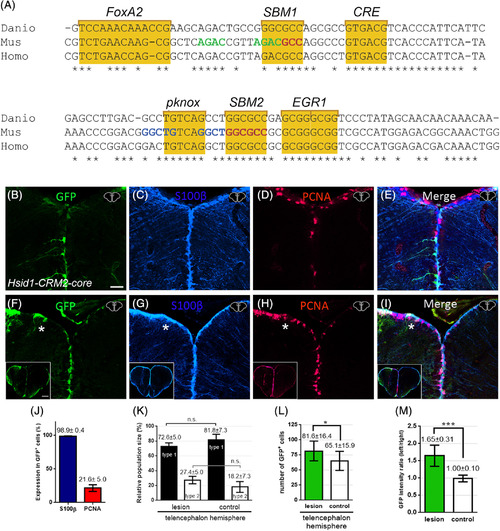
Conservation of the zebrafish id1‐CRM2 core sequences and its function across evolution. A, Sequence comparison of zebrafish id1‐CRM2‐core (Danio) with human (Homo) and mouse (Mus) orthologous sequences. Conserved nucleotides are indicated with an asterisk. Conserved motifs are outlined by yellow boxes comprising putative DNA recognition sequences for the transcription factors FoxA2, Smad (SBM1 and 2), CRE binding protein (CREB), Pknox, and EGR1. Nucleotide sequences in green, red, or blue correspond to previously identified sequences in the mouse id1 orthologue: Smad binding element (SBE), a Smad 1/5 binding site and a binding site for an unknown binding protein, respectively. B‐I, Immunohistochemistry of telencephalic transverse sections with antibodies against GFP (B, F), S100ß (C, G), and PCNA (D, H) (merged panels: E, I). B, Expression of GFP in RGCs at the telencephalic ventricular zone driven by the human id1 regulatory sequences in the zebrafish adult telencephalon. F, Expression of the human Tg(Hsid1‐CRM2) driven reporter construct is upregulated upon stab wound injury. The injured telencephalic hemisphere is labeled with a white asterisk. J, Quantification of PCNA and S100ß expression in GFP+ cells in the Tg(Hsid1‐CRM2) line. K, Relative population size of type 1 and type 2 RGCs in the control and lesioned hemispheres. The proportion of GFP+/S100β+/PCNA− type 1 and GFP+/S100+/PCNA+ type 2 stem cells is not altered in the injured hemisphere relative to the control hemisphere of the telencephalon. L, M, Quantification of GFP+ cells upon injury. The number of GFP‐expressing cells (L) and the intensity ratio between left and right hemispheres comparing undamaged hemisphere (control) and damaged telencephalic hemisphere (M) are both increased following injury. Bars: mean ± SD. Significance is indicated by asterisks: *.01 ≤ P < .05; ***P < .001. n.s. = not significant. Boxed in image in lower left‐hand corner of (F‐I) represents entire brain sections. n = 3 animals (B‐L), n = 15 sections (M). Scale bar = 20 μm (B‐I); 200 μm for boxed image in lower left‐hand corner of F‐I |
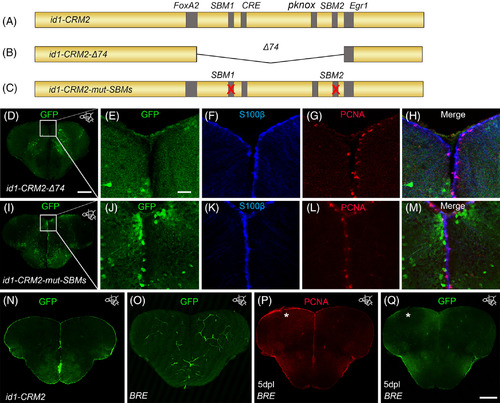
The conserved BMP response element in the id1‐CRM2 is crucial for correct expression of the GFP reporter in the ventricular zone and RGCs. A‐C, Scheme showing mutated id1‐CRM2 reporter constructs: A, id1‐CRM2 wt construct with putative TF binding sites indicated in gray. B, id1‐CRM2‐Δ74 construct which contains a deletion of a 74 bp stretch of the most conserved sequence in id1‐CRM2. C, id1‐CRM2‐mut‐SBMs construct with mutations in the 2 SBMs (1 and 2) of id1‐CRM2. D, Deletion of the 74 bp stretch in the id1‐CRM2 abolished GFP expression in the ventricular zone. E‐H, Enlarged micrographs of D. E‐H, Immunohistochemistry with GFP (E), S100ß (F), and PCNA (G) antibodies on telencephalic cross sections of the id1‐CRM2‐Δ74 transgenic line shows no GFP reporter expression in S100ß+ RGCs (H, merged view). I‐M, Mutations in Smad binding motifs (SBM1 and 2) abolished GFP expression in the ventricular zone. J‐M, Magnification of white‐boxed region in I. J‐M, Immunohistochemistry with GFP (J), S100ß (K), and PCNA (L) antibodies on telencephalic cross sections of the id1‐CRM2‐mut‐SBMs transgenic line show no colocalization between the RGC marker, S100ß, and GFP (M, merged view). N, GFP expression driven by id1‐CRM2:GFP reporter construct in the ventricular zone (control). O, P, Q Immunohistochemistry of telencephalic cross sections with GFP (O, Q) and PCNA (P). O, Q, The BRE does not drive GFP expression in the RGCs (O) and is not inducible by telencephalic injury (Q). The left injured side is labeled with a white asterisk. Anteroposterior positions of transverse sections are indicated in the upper right‐hand corner of each image. Scale bar = 20 μm (E, F, G, H, J, K, L, M); 200 μm (D, I, N, O, P, Q) |
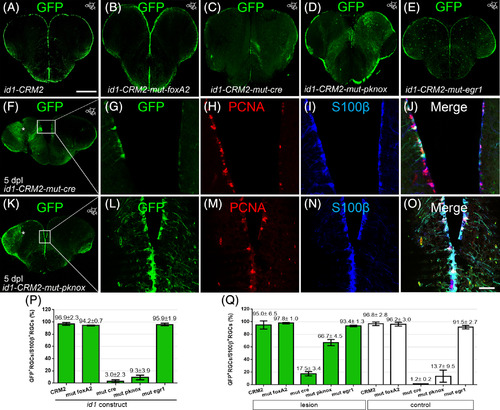
Cre and pknox binding sites in close vicinity to SBM1 and − 2 are necessary for the full activity of id1‐CRM2. A‐E, Immunohistochemistry with a GFP antibody on telencephalic cross sections of the id1‐CRM2 transgenic lines containing a mutation in the foxA2 (B), cre (C), pknox (D), and egr1 (E) binding sites, respectively. Mutation in cre (C) and pknox (D) binding sites leads to a reduction of GFP+ cells in the ventricular zone. F, G, J, Expression of the id1‐CRM2‐mut‐cre construct is inducible by brain injury (white asterisk, left injured hemisphere). G‐J, Magnification boxed area in F. K, L, O, Expression of the id1‐CRM2‐mut‐pknox construct is induced upon brain injury (white asterisk, left injured hemisphere). L‐O, Magnification of boxed area in K. Anterioposterior positions of transverse sections are indicated in the upper right‐hand corner of each image. P, Q, Percentage of GFP+/S100β+ RGCs over the total number of S100+ RGCs for id1‐CRM2 mutant constructs under homeostatic condition (P) and at 5 days postinjury, comparing the injured hemisphere (green columns) and the contralateral uninjured hemisphere (white columns; Q) at the dorsomedial to the dorsolateral region of the telencephalon. Scale bar = 200 μm (A‐F and K); 25 μm (G‐J and L‐O) |
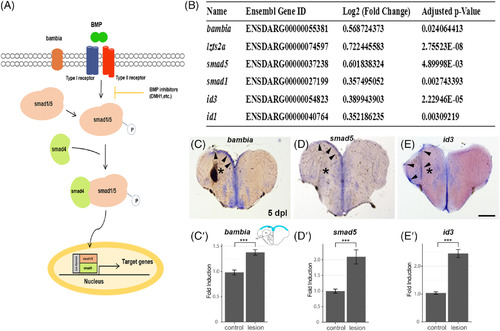
Genes involved in canonical BMP signaling are induced in response to telencephalic injury. A, Scheme of the BMP signaling pathway. B, RNAseq analysis of injured telencephala hemispheres in comparison to uninjured hemispheres reveals an upregulation in mRNA expression of BMP signal transducers (smad5), regulators (bambia) or downstream target genes (id3, id1). C‐E, In situ hybridization on sections of the adult zebrafish telencephalon 5 days postlesion. C, bambia, D, smad5, E, id3. Arrowheads indicate upregulation of gene expression in the left telencephalic hemisphere upon stab injury. C′‐E′, Quantification of C´bambia, D′, smad5, and E′, id3 expression upregulation 5 days postlesion. Only upregulated areas were quantified along the control and injured ventricular zone from the dorsomedial to the dorsolateral region of the telencephalon (scheme in the upper right‐ hand corner of (C′) shows the quantified area in blue). Significance is indicated by asterisks: ***P < .001. P‐values: bambia: 0.00008917 (C′), smad5: 0.003684 (D′), id3: 7.455 x 10⁻⁷ (E′). Scale bar = 200 μm (C, D, E) |
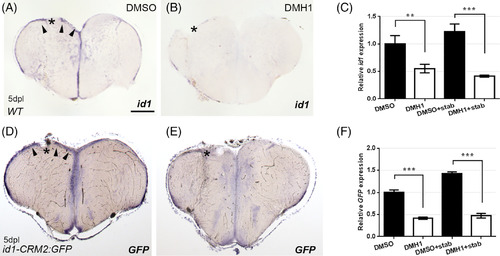
Inhibition of BMP signaling with DMH1 reduces injury‐induced id1 and id1‐CRM2:GFP transgene expression. ISH against id1 (A, B) and gfp mRNA (D, E) showed reduction in induction of id1 (B) and gfp (E) transgenes upon BMP signaling inhibition by DMH1 treatment (B and E) in comparison to DMSO‐treated corresponding controls (A and D). Arrowheads indicate upregulation of gene expression the left telencephalic hemisphere upon stab injury. C, F, RT‐qPCR quantification confirmed reduction in id1 and gfp expression in DMH1 treated fish. The data represent the mean ± SD of three independent experiments. Significance is indicated by asterisks:**.001 ≤ P < .01; ***P < .001. Scale bar = 200 μm (A, B, D, and E). n = 3 animals for C, F |