
Fig. 3
- ID
- ZDB-FIG-210510-19
- Publication
- Barker et al., 2020 - Functional, molecular and morphological heterogeneity of superficial interneurons in the larval zebrafish tectum
- Other Figures
- All Figure Page
- Back to All Figure Page
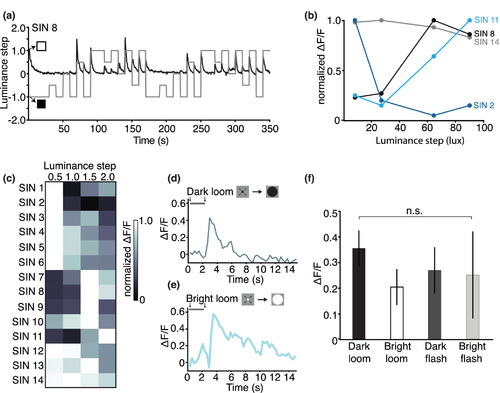
A subset of Gal4s1156t+ SINs display narrow tuning to incremental luminance changes. (a) Gal4s1156t+ SINs were tested in response to a luminance step stimulus. Four progressive whole‐field luminance steps from black (2.7 lux) to white (92.8 lux) were presented in both directions (darkening and brightening). Here responses from an example SIN (SIN 8 in (c)) in an 8 dpf Gal4s1156t × UAS:GCaMP6s larva are shown. Normalized luminance steps are indicated in gray, raw calcium responses are shown in black. Luminance steps of 0.5, 1.0, 1.5, and 2.0 correspond to lux changes of 8.2, 27.1, 64.5, and 90.1 lux respectively. (b) Luminance step tuning curves in 4 Gal4s1156t+ SINs demonstrate peak tuning distributed across the range of luminance steps tested (n = 14 cells, 8 larvae). The tuning curve for the SIN shown in (a) is plotted here in black. For this cell, the strongest calcium responses are observed at larger luminance steps, peaking with a luminance step of 64.5 lux and decreasing slightly at the largest step size tested (90.1 lux). (c) Luminance step responses are shown for all 14 SINs recorded in 8 larvae. Heat map shows normalized ΔF/F values for each cell. Luminance steps of 0.5, 1.0, 1.5, and 2.0 correspond to lux changes of 8.2, 27.1, 64.5, and 90.1 lux, respectively. Responses to OFF and ON steps were pooled. (d,e) Gal4s1156t+ SINs respond to bright and dark looming stimuli with similar response amplitudes and dynamics. Responses to dark (top) and bright loom (bottom) are shown for the same cell. The visual stimulus is displayed above each trace. (f) Gal4s1156t+ SINs do not show preferential tuning to bright or dark looming stimuli when compared to equivalent whole‐field flashes (n = 11 cells in 5 larvae, one‐way ANOVA, Tukey's correction, p = .787). n.s., not statistically significant. Error bars are SEM |