
Fig. 2
- ID
- ZDB-FIG-210510-18
- Publication
- Barker et al., 2020 - Functional, molecular and morphological heterogeneity of superficial interneurons in the larval zebrafish tectum
- Other Figures
- All Figure Page
- Back to All Figure Page
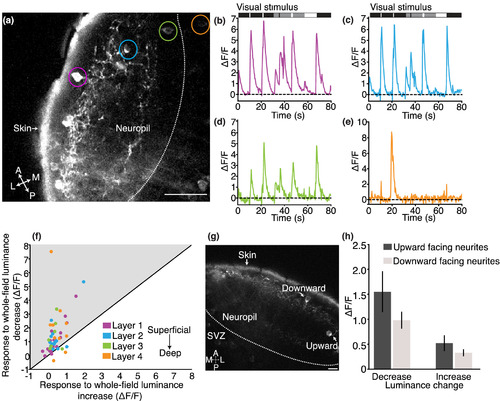
Gal4s1156t+ SIN responses to whole‐field luminance changes are consistent across tectal neuropil layers. (a) Imaging plane in a 7 dpf Gal4s1156t x UAS:GCaMP6s larva. (b) Example of a superficially positioned SIN (layer 1, magenta and indicated by magenta circle in (a), demonstrating a characteristic response to all luminance transitions. (c) Example trace of a SIN with its cell body positioned in an intermediate layer (layer 2, blue and indicated by blue circle in (a). (d) Example trace from a SIN with its cell body positioned in the deepest layer (layer 3, green and indicated by green circle in (a). (e) Gal4s1156t+ PVNs display more narrowly tuned response profiles to whole‐field luminance transitions. An example PVN (layer 4, orange and indicated by orange circle in (a)) trace is shown here. (f) Nearly all Gal4s1156t+ SINs (same cells as shown in Figure 1 plus 10 PVNs, n = 57 cells in 17 larvae) show greater responses to OFF than to ON, across all neuropil layers. (g) Gal4s1156t+ SINs either have upward‐ or downward‐oriented neurites. (h) OFF or ON responses are not significantly different between Gal4s1156t+ SINs with upward‐ or downward‐oriented neurites (unpaired t‐tests, p = .13 for OFF, p = 0.22 for ON). Scale bar in (a) = 20 μm, (g) = 10 μm. A, anterior; L, lateral; M, medial; P, posterior. Error bars are SEM |