
Figure 7
- ID
- ZDB-FIG-210503-167
- Publication
- Lasseigne et al., 2021 - Electrical synaptic transmission requires a postsynaptic scaffolding protein
- Other Figures
-
- Figure 1
- Figure 1-figure supplement 1-source data 1.
- Figure 2
- Figure 2-figure supplement 1-source data 1.
- Figure 3
- Figure 3-figure supplement 1-source data 1.
- Figure 3-figure supplement 2.
- Figure 4
- Figure 5-source data 1.
- Figure 6
- Figure 6-figure supplement 1
- Figure 7
- Figure 7-figure supplement 1-source data 1.
- All Figure Page
- Back to All Figure Page
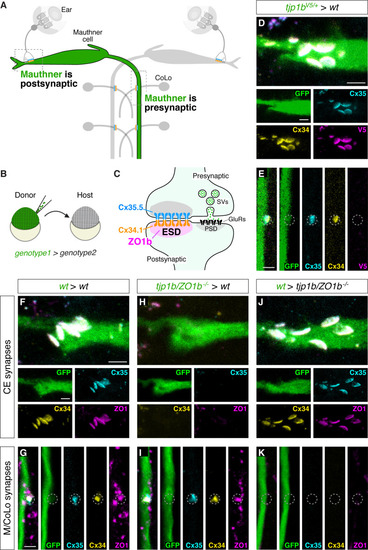
(A) Schematic of the Mauthner circuit in chimeric animals. One Mauthner cell is derived from the GFP-expressing donor (green), while other neurons derive from the non-transgenic host (gray). The image represents a dorsal view with anterior to the top. Electrical synapses denoted as yellow (Cx34.1) and cyan (Cx35.5) rectangles. Boxed regions indicate regions imaged for analysis. (B) Diagram of experiment in which GFP-expressing donor cells are transplanted into a non-transgenic host to create chimeric embryos. GFP-expressing cells are of genotype1 while the rest of the cells in the chimeric embryo are derived from genotype2. (C) Diagram of a mixed electrical/chemical (glutamatergic) synapse summarizing data for ZO1b. ESD = electrical synapse density, see Discussion. (D–K) Confocal images of Mauthner circuit neurons and stereotypical electrical synaptic contacts in 5-day-post-fertilization, chimeric zebrafish larvae. Animals are stained with anti-GFP (green), anti-zebrafish-Cx35.5 (cyan), and anti-zebrafish-Cx34.1 (yellow). In panels (D–E), animals are stained with anti-V5 (magenta), and in (F–K) animals are stained with anti-human-ZO1 (magenta). The genotype of the donor cell (green, genotype1) and host (genotype2) varies and is noted above each set of images (genotype1 > genotype2). Images of CEs (D,F,H,J) are maximum-intensity projections of ~5 µm. Images of M/CoLo synapses (E,G,I,K) are single Z-slices. Neighboring panels show individual channels. Scale bar = 2 µm in all images. |