|
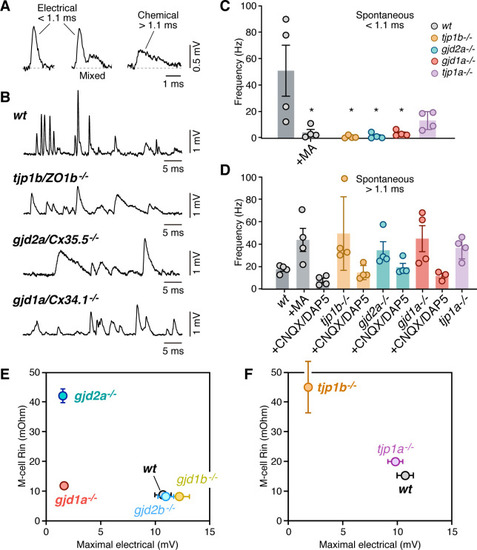
Lack of electrical transmission in <italic>tjp1b/ZO1b<sup>-/-</sup></italic> is widespread and alters M-cell excitability.(A) Spontaneous responses in wildtype (wt) zebrafish can be electrical, chemical, or mixed. Spontaneous electrical and chemical responses were identified for automated detection by their duration: electrical responses were brief (<1.1 ms), whereas chemical responses were longer lasting (>1.1 ms). Mixed responses combined both. (B) Representative single traces of spontaneous synaptic activity obtained from the Mauthner cells of wt, tjp1b/ZO1b-/-, gjd2a/Cx35.5-/-, and gjd1a/Cx34.1-/-. Note the lack of short-lasting spontaneous responses in mutant zebrafish (membrane potential = −89, –87, and −89 mV, respectively). (C) Bar graph summarize the frequency in Hz (mean ± SEM; each n represents a fish) of the spontaneous short-lasting (<1.1 ms) electrical responses in wt, tjp1b/ZO1b-/-, gjd2a/Cx35.5-/-, gjd1a/Cx34.1-/- and tjp1a/ZO1a-/- zebrafish. The frequency of events in wt zebrafish was 50.9 ± 19.2 Hz (n = 4) and was reduced by MA (200 µM) to 4.2 ± 2.3 Hz (p<0.05). The variability between WT fish reflects different states of the network. The frequency was dramatically reduced in mutant zebrafish lacking electrical transmission: tjp1b/ZO1b-/-: 0.85 ± 0.5 Hz (n = 4; p<0.05); gjd2a/Cx35.5-/-: 1.5 ± 1.0 Hz (n = 4; p<0.05); gjd1a/Cx34.1-/-: 3.4 ± 1.1 Hz (n = 4, p<0.05). Although reduced, the change was not significant in tjp1a/ZO1a-/-: 13.2 ± 3.4 Hz (n = 4). (D) Long-lasting (>1.1 ms) chemical responses. The frequency of events in wt zebrafish was 17.8 ± 1.8 Hz (n = 4) and increased after MA to 43.8 ± 10.2 Hz (n = 4; p<0.05). The frequency was also increased in mutant zebrafish: tjp1b/ZO1b-/-: 49.5 ± 16.3 Hz (n = 4, p<0.05); gjd2a/Cx35.5-/-: 34.6 ± 7.7 Hz (n = 4, p<0.05); gjd1a/Cx34.1-/-: 45.0 ± 11.6 Hz (n = 4, p<0.05); tjp1a/ZO1a-/-: 36.8 ± 4.9 Hz (n = 4, p<0.05). Spontaneous events > 1.1 ms were greatly reduced by glutamate receptor antagonists (20 µM, CNQX/DAP5). The remaining responses likely represent depolarizing inhibitory responses prominent in the Mauthner cell. (E–F) Changes in the excitability of the Mauthner cell in Connexin and ZO1 zebrafish mutants. The graphs plot the input resistance of the Mauthner cell (R–in) vs the maximal amplitude of the electrical component of the synaptic response for wt and Connexin (E) and ZO1 (F) mutants. See Table 1 for values of Rn and Figure 3 for those of maximal electrical amplitude. Bars represent standard deviation. Associated experimental statistics can be found in for Figure 4—source data 1
|