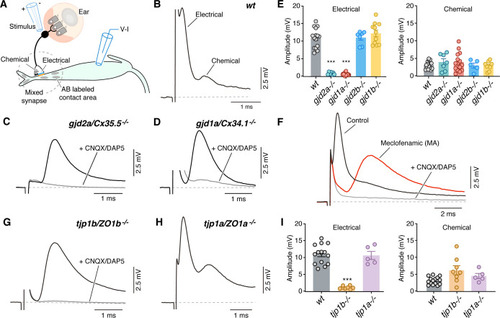
(A) Diagram illustrates the experimental paradigm to examine synaptic transmission. (B) The ‘mixed’ synaptic response in the Mauthner cell evoked by extracellular stimulation of auditory afferents known as club endings (CEs) is composed in wt zebrafish larvae of an early electrical and a delayed chemically mediated response (membrane potential = −79 mv). Traces here and elsewhere represent the average of at least 10 single synaptic responses. (C,D) gjd2a/Cx35.5-/- and gjd1a/Cx34.1-/- mutant zebrafish had no detectable electrical component (black traces). The remaining synaptic response was blocked by bath application of CNQX and DAP5 (20 µM each) that block AMPA and NMDA glutamate receptors, respectively (membrane potential = −83.2 and −81 mv, respectively). (E) Bar graphs summarize the maximal amplitude (mean ± SEM), at a stimulation strength at which all CEs are activated, for the electrical and chemical components in wt and Connexin mutant zebrafish. Left, electrical: wt: 10.9 ± 0.7 mV (n = 15); gjd2a/Cx35.5-/-: 0.8 ± 0.1 mV (p<0.0001, n = 7); gjd1a/Cx34.1-/-: 0.6 ± 0.1 mV (p<0.00001, n = 15); gjd2b/Cx35.1-/-: 11.0 ± 0.7 (n = 7); gjd1b/Cx34.7-/-: 12.2 ± 0.9 mV (n = 11). The values in mutants lacking electrical transmission represent the membrane potential measured at the delay, which show the expected electrical component. Right, chemical: wt: 3.1 ± 0.3 mV (n = 15); gjd2a/Cx35.5-/-: 3.9 ± 0.9 mV (n = 7); gjd1a/Cx34.1-/-: 3.9 ± 0.7 mV (n = 15); gjd2b/Cx35.1-/-: 3.0 ± 0.7 mV (n = 5); gjd1b/Cx34.7-/-:2.9 ± 0.4 mV (n = 9). (F) Blocking electrical transmission recapitulates gjd2a/Cx35.5-/- and gjd1a/Cx34.1-/- synaptic phenotypes. Synaptic responses are superimposed and obtained before (black trace) and after (red trace) adding Meclofenamic acid (MA, 200 µM) to the perfusion solution. The remaining synaptic response was blocked (gray trace) after adding CNQX/DAP5 (20 µM each) to the perfusion solution (membrane potential = −81 mv). (G) tjp1b/ZO1b-/- zebrafish lack electrical transmission (black trace). The remaining synaptic potential was blocked by CNQX/DAP5 (20 µM each; gray trace) (membrane potential = −82 mv). (H) Synaptic responses in tjp1a/ZO1a-/- zebrafish show both electrical and chemical components (membrane potential = −87 mv). (I) Bar graphs illustrate the maximal amplitude (mean ± SEM) for the electrical and chemical components of the synaptic response in wt and ZO1 mutant zebrafish. Left, Electrical: tjp1b/ZO1b-/-: 1.1 ± 0.2 mV (p-value<0.0005, n = 8); tjp1a/ZO1a-/-: 10.6 ± 1.2 mV (n = 5). Right, chemical: tjp1b/ZO1b-/-: 6.2 ± 1.3 mV (n = 8); tjp1a/ZO1a-/-: 4.5 ± 0.8 mV (n = 5). Associated experimental statistics can be found in Figure 3—source data 1.
|
