
Figure 5
- ID
- ZDB-FIG-210414-69
- Publication
- Ambrosini et al., 2020 - Progressively De-Differentiated Pancreatic Cancer Cells Shift from Glycolysis to Oxidative Metabolism and Gain a Quiescent Stem State
- Other Figures
- All Figure Page
- Back to All Figure Page
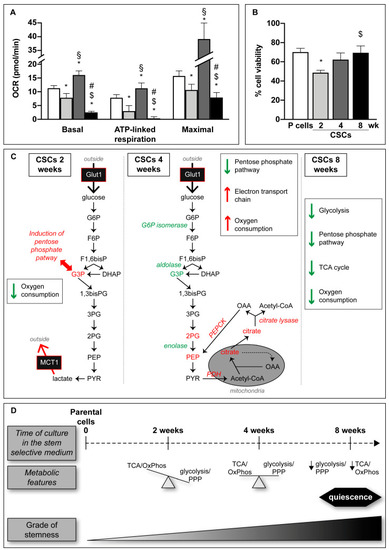
Metabolic features of CSCs. (A) Seahorse analysis of Panc1 P and CSCs cultured in their specific-medium; 6 × 10⁴ cells/well and 1 × 10⁵ cells/well of P and CSCs respectively have been plated for each condition. After 24 h, cells were treated with FCCP (400 nM), oligomycin (1 µg), and a mix of antimycin and rotenone (both 1 µM) and then analyzed. Histograms legends: white: parental (P) cells; light gray: CSCs 2 weeks; dark grey: CSCs 4 weeks; black: CSCs 8 weeks. (B) Cell viability analysis of Panc1 P cells and CSCs treated with 50 nM AZD3965, the MCT-1 inhibitor, for 72 h. Molecular (C) and schematic (D) representations of the data presented in this paper showing the metabolic plasticity of CSCs. In green are indicated the metabolites or metabolic enzymes whose intracellular level or expression, respectively, is decreased. Instead, are reported in red when their level is increased. In italic are reported the enzyme’s name. Values are the means (± SE) of three independent biological replicates. Statistical legend: p <0.05 (*) P cells versus CSCs; (§) CSCs 2 weeks versus CSCs 4 weeks; ($) CSCs 2 weeks versus CSCs 8 weeks; (#) CSCs 4 weeks versus CSCs 8 weeks. Legends: glucose transporter (Glut1); glucose-6-phosphate (G6P); fructose-6-phosphate (F6P); fosfofructokinase (PFK); fructose 1,6-bisphosphate (F1,6bisP); glyceraldehyde-3-phosphate (G3P); dihydroxyacetone phosphate (DAHP); 1,3-bisphospho glycerate (1,3bisPG); 3-phosphoglycerate (3PG); 2-phosphoglycerate (2PG); phosphoenolpyruvate (PEP); pyruvate (PYR); monocarboxylate transporter-1 (MCT1); pyruvate dehydrogenase (PDH); oxaloacetate (OAA); phosphoenolpyruvate carboxykinase (PEPCK); tricarboxylic acid (TCA) cycle; oxidative phosphorylation (OxPhos); pentose phosphate pathway (PPP). |