
Figure 1
- ID
- ZDB-FIG-210414-65
- Publication
- Ambrosini et al., 2020 - Progressively De-Differentiated Pancreatic Cancer Cells Shift from Glycolysis to Oxidative Metabolism and Gain a Quiescent Stem State
- Other Figures
- All Figure Page
- Back to All Figure Page
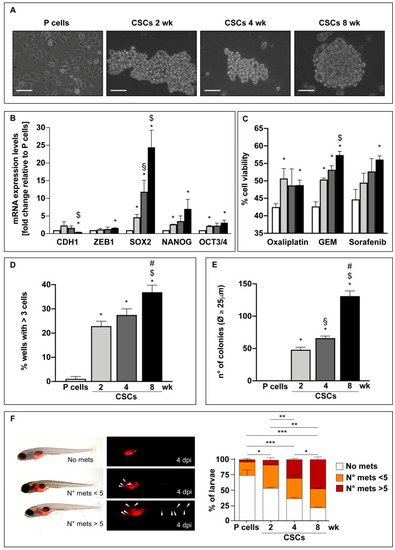
Panc1 cells cultured in the stem-specific medium for 2, 4, and 8 weeks enhance their epithelial-to-mesenchymal transition (EMT)/stem properties. (A) Bright field representative images of Panc1 parental cells (P) and Panc1 cancer stem cells (CSCs) cultured in the stem-specific medium for 2, 4, and 8 weeks. Scale bar: 100 μm. (B) qPCR analysis of the basal expression of EMT markers, i.e., CDH1 and ZEB1, and stem markers, i.e., SOX2, NANOG, and OCT3/4, in Panc1 P cells and CSCs. The values are reported as fold change relative to P cells. (C) Cell viability analysis of Panc1 P cells and CSCs treated with 100 μM Oxaliplatin or 50 μM Gemcitabine (GEM) or 20 μM Sorafenib for 48 h. (D) Clonogenic assay: The percentage of wells in 96 well-plates with more than 3 cells is reported after 15 days of the seeding of 1 cell/well of Panc1 P cells or CSCs. (E) Soft agar colony formation assay: The number of Panc1 P or CSC colonies with diameter ≥ 25 μm grown in soft agar is reported after 21 days of 5 × 10⁴ cells seeded in each well. Histograms legends: white: P cells; light gray: CSCs 2 weeks; dark grey: CSCs 4 weeks; black: CSCs 8 weeks. (F) Panc1 parental cells and CSCs were stained with Vybrant Cell Labeling Solution (red) and injected into the yolk of zebrafish larvae at 2 dpf. The percentage of larvae with metastasis-forming cells was counted at 4 days post injection (dpi) in each experimental condition and reported in the histograms. Histograms legends: No mets.= larvae with no tumor cells outside the yolk; n mets < 5 = larvae with <5 tumor cells outside the yolk; n mets > 5 = larvae with >5 tumor cells outside the yolk. Histograms legends: white: P cells; light gray: CSCs 2 weeks; dark grey: CSCs 4 weeks; black: CSCs 8 weeks. Values are the means (± SE) of at least three independent biological replicates for in vitro assays and two biological replicates for in vivo assay. Statistical legend: p < 0.05 (*), p < 0.01 (**), or p < 0.001 (***) P cells versus CSCs; (§) CSCs 2 weeks versus CSCs 4 weeks; ($) CSCs 2 weeks versus CSCs 8 weeks; (#) CSCs 4 weeks versus CSCs 8 weeks. |