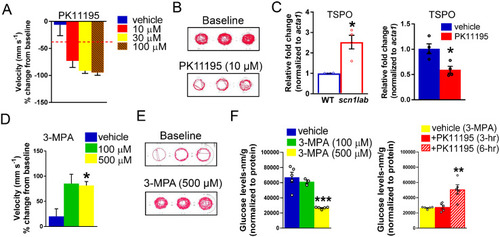
PK11195 is a positive hit in both metabolic and behaviour phenotyping assays. (A) Bar graph representing percent change in mean velocity (mm s−1) in scn1lab mutant larvae (6 dpf) treated with three concentrations of PK11195 (10, 30 and 100 μM) for 3-h. Locomotion was recorded for 10-min in DanioVision system using a locomotion tracking software (EthoVision XT 11.5-Noldus Information Technology). PK11195 at both 10 and 30 μM showed significant decrease in mean velocity. PK11195 at 100 μM was a toxic dose. Data are presented as mean change in velocity ± SEM with n = 36. The cut-off for significant decrease in mean velocity is set at ≥40% (dashed line). (B) Representative traces of locomotion plots obtained from 10-min recordings for baseline and 10 μM PK11195-treated larvae are shown. (C) The bar graph represents qPCR data with increased expression of Tspo mRNA in scn1lab mutants compared to wild-type. The bar graph on the right represents qPCR data with relative fold change of Tspo with 3-h PK11195-treated scn1lab mutants. No significant change was observed; however, a trend of decreased Tspo expression was seen in PK11195-treated scn1lab mutants. Data were normalized to the housekeeping gene acta1 and presented as mean ± S.E.M. Statistics were performed by Student’s unpaired t-test. Asterisks (*) indicate a significance *P < 0.05. Values represent averages from n = 3, where each sample represents 10–12 pooled 6-dpf larvae. (D) The bar graph represents increased swim behaviour in 5-dpf wild-type larvae treated with 500 μM 3-MPA. No increase in swim behaviour was observed with 100 μM 3-MPA (n = 24). WT refers to wild-type larvae. (E) Representative traces of locomotion plots obtained from 10-min recordings for baseline and 500 µM 3-MPA-treated wild-type larvae are shown. (F) Representative bar graph showing glucose levels (normalized to total protein) in 3-MPA-treated wild-type larvae. A significant decrease of glucose levels was observed in 3-MPA-treated larvae (3- and 6-h) when compared with vehicle (wild-type untreated larvae). The bar graph in the right-hand side represents glucose levels in PK11195-treated larvae. A significant increase of glucose levels was observed in larvae that were incubated with 3-MPA (500 μM) and PK11195 (10 μM) for 6-h but not for 3-h compared with vehicle (3-MPA-treated larvae). Data are presented as mean ± SEM. Statistics were performed by two-way ANOVA followed by Tukey’s multiple comparison test with significance taken as **P < 0.01, ***P < 0.001 and ****P < 0.0001. Values represent averages for n = 5, where each sample represents 20 pooled larvae.
|
