FIGURE SUMMARY
Title

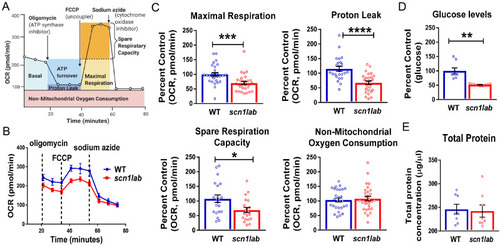
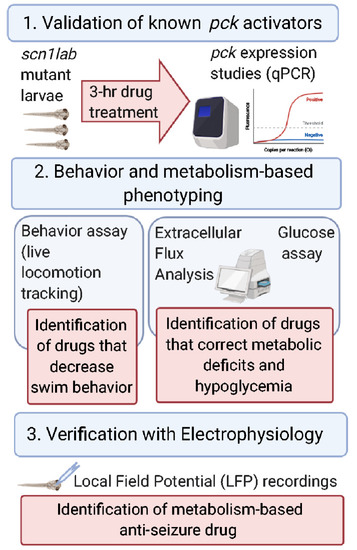
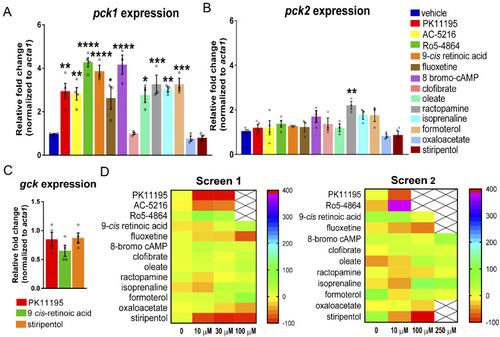
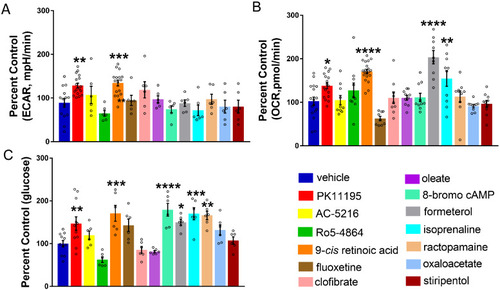
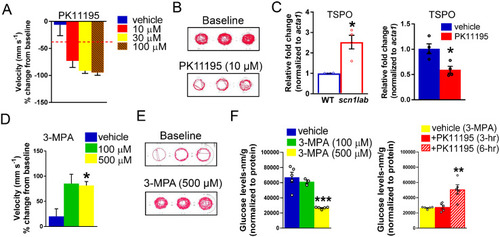
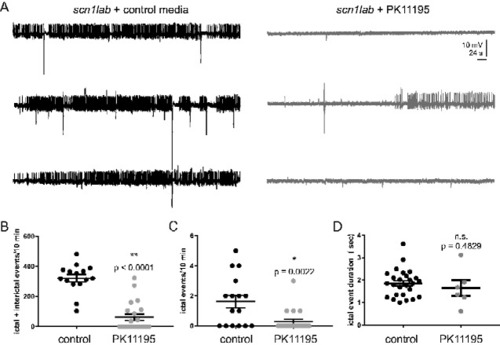
Enhancing glucose metabolism via gluconeogenesis is therapeutic in a zebrafish model of Dravet syndrome

Authors
Banerji, R., Huynh, C., Figueroa, F., Dinday, M.T., Baraban, S.C., Patel, M.
Source
Full text @ Brain Commun

The scn1lab mutants have impaired mitochondrial bioenergetics and are hypoglycemic. (A) A schematic representation of a complete metabolic profile of mitochondrial respiration for measuring different mitochondrial indices using the XF Seahorse Mito Stress Test. Agilent Technologies, Inc.© 2020, adapted and reproduced with permission, courtesy of Agilent Technologies, Inc. Figure created with BioRender.com. (B) The Seahorse Bioanalyzer was used to measure OCR in 6-dpf scn1lab and wild-type larvae by sequentially adding oligomycin, FCCP and sodium azide (instead of antimycin A/rotenone). A representative OCR profile plot from a single run represents decreased OCR in scn1lab mutant compared to wild-type group. (C) Bar graphs represent mitochondrial metabolic parameters. There is a significant decrease in maximal respiration, proton leak and spare respiratory capacity in scn1lab mutants compared to the wild-type larvae. There is no significant difference in non-mitochondrial consumption rate. Data are presented as mean ± SEM and are normalized to the control group (wild type). Statistics performed by unpaired-t test with Welch’s correction. Asterisks (*) indicate a significance of difference between the two groups at *P <0.05, **P <0.01 and ***P <0.001 and ****P <0.0001; the data points represent each larva, n = 20 for each group. (D) Representative bar graph depicting glucose levels in 6-dpf scn1lab and wild-type larvae. There is a significant decrease in glucose levels in the scn1lab mutants compared to the wild-type larvae. Data are presented as mean ± SEM and are normalized to the control group (wild type). (E) Representative bar graph depicting total protein levels in 6-dpf scn1lab and wild-type larvae. No significant difference is observed in the total protein levels between the two groups. Data are presented as mean ± SEM. For (D) and (E), statistics were performed by unpaired-t test with Welch’s correction. Asterisks (*) indicate a significance of difference between the two groups at **P <0.01. n = 8, where each sample represents 20 pooled larva. In all panels, WT refers to wild-type larvae.

Schematic representation of the workflow of the experimental strategy. The three main steps to identify metabolism-based anti-epileptic drugs for Dravet syndrome include: validation of pck activators, behaviour and metabolism-based phenotyping and finally verification with electrophysiology. (Figure created with BioRender.com).

Reduction in convulsive seizure-like swim behaviour with validated pck1 activators. (A) The bar graph represents qPCR data with relative fold change of pck1 gene in 3-h drug-treated scn1lab mutants. The drugs that had more than 4-fold up-regulation of pck1 were 9-cis retinoic acid, Ro5-4864 and 8-bromo-cAmp and with more than 2-fold up-regulation were PK11195, AC-5216, fluoxetine, isoprenaline, formoterol, oleate and ractopamine. (B) The bar graph represents qPCR data with relative fold change of pck2 gene in 3-h drug-treated scn1lab mutants. No significant up-regulation of pck2 was observed except with ractopamine. (C) No change in expression of gck gene was observed in drug-treated scn1lab mutants. Drugs include PK 11195, 9-cis retinoic acid and stiripentol. Data for A, B and C were normalized to the housekeeping gene acta1 and presented as mean ± S.E.M. Statistics were performed by one-way ANOVA followed by Dunnett’s multiple comparison test with significance taken as *P <0.05, **P <0.01, ***P <0.001 and ****P <0.0001. Values represent averages from n = 4, where each sample represents 10–12 pooled 6-dpf scn1lab mutant larvae. (D) Behaviour-based screening of validated pck1 activators. Heat maps representing change in mean velocity of scn1lab mutants in response to the 13 compounds with 3-h treatment. The heat maps represent two independent screens of behaviour phenotyping in scn1lab mutants. Screen 1 represents percent change in mean velocity (mm s−1) in scn1lab larvae treated with three concentrations (10, 30 and 100 μM) of the drugs for 3-h (performed in UCD facility). Screen 2 represents behaviour screen performed in UCSF facility with three concentrations (10, 100 and 250 μM). The locomotion assay was recorded for 10 min in Danio Vision system using locomotion tracking software (EthoVision XT 11.5-Noldus Information Technology). PK11195 at 10 and 30 μM; AC-5216 at 10 and 30 μM; fluoxetine at 100 μM shows significant decrease in mean velocity (threshold set as ≥40%). Stiripentol was used as a positive control in both screens. Each box represents the percent change in velocity from independent locomotion assays with at least six scn1lab larvae (n = 36). Toxic dose is represented with a cross and the scale at the right-hand side represents the range in percent change in mean velocity.

Correcting metabolic deficits and hypoglycaemia with validated pck1 activators. (A) Representative bar graph showing baseline ECAR in 6-dpf scn1lab mutants treated with pck1 activators. A significant increase was observed in ECAR for PK11195 and 9-cis retinoic acid. Data are presented as mean ± SEM normalized to wild-type controls. Statistics were performed by one-way ANOVA followed by Dunnett’s multiple comparison test with significance taken as **P <0.01 ***P <0.001 and ****P <0.0001 (n = 10). (B) Representative bar graph showing baseline OCR in scn1lab mutants treated with pck1 activators. A significant increase in OCR was observed for PK11195, 9-cis retinoic acid, formoterol and isoprenaline. Data are presented as mean ± SEM normalized to wild-type controls. Statistics were performed by one-way ANOVA followed by Dunnett’s multiple comparison test with significance taken as **P <0.01, ***P <0.001 and ****P <0.0001 (n = 10). (C) Representative bar graph showing glucose levels (normalized to total protein) in drug-treated scn1lab mutants. There is a significant increase in glucose levels in the scn1lab mutants treated with PK11195, 9-cis retinoic acid, formoterol, 8-bromo-cAMP and ractopamine, compared to the DMSO control (vehicle). Data are presented as mean ± SEM normalized to wild-type controls. Statistics were performed by one-way ANOVA followed by Dunnett’s multiple comparison test with significance taken as *P <0.05, **P <0.01 and ***P <0.001. Values represent averages from n = 11, vehicle, PK11195; (n = 6), other drugs, where each sample represents 10–20 pooled larvae. In all panels, WT refers to wild-type larvae.

PK11195 is a positive hit in both metabolic and behaviour phenotyping assays. (A) Bar graph representing percent change in mean velocity (mm s−1) in scn1lab mutant larvae (6 dpf) treated with three concentrations of PK11195 (10, 30 and 100 μM) for 3-h. Locomotion was recorded for 10-min in DanioVision system using a locomotion tracking software (EthoVision XT 11.5-Noldus Information Technology). PK11195 at both 10 and 30 μM showed significant decrease in mean velocity. PK11195 at 100 μM was a toxic dose. Data are presented as mean change in velocity ± SEM with n = 36. The cut-off for significant decrease in mean velocity is set at ≥40% (dashed line). (B) Representative traces of locomotion plots obtained from 10-min recordings for baseline and 10 μM PK11195-treated larvae are shown. (C) The bar graph represents qPCR data with increased expression of Tspo mRNA in scn1lab mutants compared to wild-type. The bar graph on the right represents qPCR data with relative fold change of Tspo with 3-h PK11195-treated scn1lab mutants. No significant change was observed; however, a trend of decreased Tspo expression was seen in PK11195-treated scn1lab mutants. Data were normalized to the housekeeping gene acta1 and presented as mean ± S.E.M. Statistics were performed by Student’s unpaired t-test. Asterisks (*) indicate a significance *P < 0.05. Values represent averages from n = 3, where each sample represents 10–12 pooled 6-dpf larvae. (D) The bar graph represents increased swim behaviour in 5-dpf wild-type larvae treated with 500 μM 3-MPA. No increase in swim behaviour was observed with 100 μM 3-MPA (n = 24). WT refers to wild-type larvae. (E) Representative traces of locomotion plots obtained from 10-min recordings for baseline and 500 µM 3-MPA-treated wild-type larvae are shown. (F) Representative bar graph showing glucose levels (normalized to total protein) in 3-MPA-treated wild-type larvae. A significant decrease of glucose levels was observed in 3-MPA-treated larvae (3- and 6-h) when compared with vehicle (wild-type untreated larvae). The bar graph in the right-hand side represents glucose levels in PK11195-treated larvae. A significant increase of glucose levels was observed in larvae that were incubated with 3-MPA (500 μM) and PK11195 (10 μM) for 6-h but not for 3-h compared with vehicle (3-MPA-treated larvae). Data are presented as mean ± SEM. Statistics were performed by two-way ANOVA followed by Tukey’s multiple comparison test with significance taken as **P <0.01, ***P <0.001 and ****P <0.0001. Values represent averages for n = 5, where each sample represents 20 pooled larvae.

PK11195 treatment effectively suppresses electrographic seizure activity. (A) Representative 10-min local field LFP recording epochs with 6-dpf scn1lab mutants treated with control media and 10 μM PK11195 for 3-h. (B) The graph shows a significant reduction in the frequency of ictal- and inter-ictal-like electrographic seizure events with a 3-h 10 μM PK11195 exposure. (C) The graph shows a significant effect of 3-h 10 μM PK11195 exposure in significantly suppressing ictal events alone. (D) No change in ictal event duration was observed among the two groups. All drug-treated scn1lab mutant larvae were freed from agar post-experiment and the survival rate at 24-h was 94%. Data represent 6 dpf from three independent clutches, n = 17 for controls; n = 22 for PK11195 treatment. Data are presented as mean ± SEM; Student’s unpaired t-test was used. Asterisks (*) indicate a significance *P < 0.05; **P < 0.001.

Acknowledgments
This image is the copyrighted work of the attributed author or publisher, and ZFIN has permission only to display this image to its users. Additional permissions should be obtained from the applicable author or publisher of the image. Full text @ Brain Commun