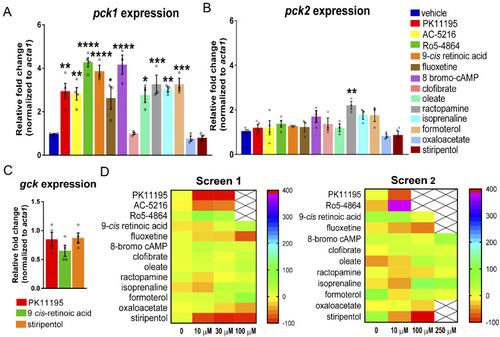
Reduction in convulsive seizure-like swim behaviour with validated pck1 activators. (A) The bar graph represents qPCR data with relative fold change of pck1 gene in 3-h drug-treated scn1lab mutants. The drugs that had more than 4-fold up-regulation of pck1 were 9-cis retinoic acid, Ro5-4864 and 8-bromo-cAmp and with more than 2-fold up-regulation were PK11195, AC-5216, fluoxetine, isoprenaline, formoterol, oleate and ractopamine. (B) The bar graph represents qPCR data with relative fold change of pck2 gene in 3-h drug-treated scn1lab mutants. No significant up-regulation of pck2 was observed except with ractopamine. (C) No change in expression of gck gene was observed in drug-treated scn1lab mutants. Drugs include PK 11195, 9-cis retinoic acid and stiripentol. Data for A, B and C were normalized to the housekeeping gene acta1 and presented as mean ± S.E.M. Statistics were performed by one-way ANOVA followed by Dunnett’s multiple comparison test with significance taken as *P < 0.05, **P < 0.01, ***P < 0.001 and ****P < 0.0001. Values represent averages from n = 4, where each sample represents 10–12 pooled 6-dpf scn1lab mutant larvae. (D) Behaviour-based screening of validated pck1 activators. Heat maps representing change in mean velocity of scn1lab mutants in response to the 13 compounds with 3-h treatment. The heat maps represent two independent screens of behaviour phenotyping in scn1lab mutants. Screen 1 represents percent change in mean velocity (mm s−1) in scn1lab larvae treated with three concentrations (10, 30 and 100 μM) of the drugs for 3-h (performed in UCD facility). Screen 2 represents behaviour screen performed in UCSF facility with three concentrations (10, 100 and 250 μM). The locomotion assay was recorded for 10 min in Danio Vision system using locomotion tracking software (EthoVision XT 11.5-Noldus Information Technology). PK11195 at 10 and 30 μM; AC-5216 at 10 and 30 μM; fluoxetine at 100 μM shows significant decrease in mean velocity (threshold set as ≥40%). Stiripentol was used as a positive control in both screens. Each box represents the percent change in velocity from independent locomotion assays with at least six scn1lab larvae (n = 36). Toxic dose is represented with a cross and the scale at the right-hand side represents the range in percent change in mean velocity.
|
