
Fig. 6
- ID
- ZDB-FIG-210324-6
- Publication
- Ye et al., 2020 - Enteroendocrine cells sense bacterial tryptophan catabolites to activate enteric and vagal neuronal pathways
- Other Figures
- All Figure Page
- Back to All Figure Page
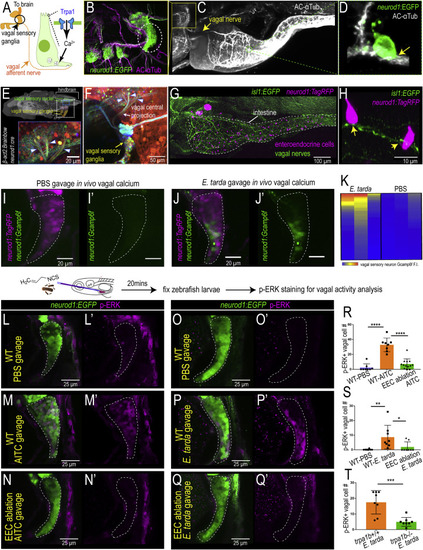
Figure 6. EEC Trpa1 signaling activates vagal sensory ganglia (A) Working model. (B) Confocal image of zebrafish vagal sensory ganglia labeled with Tg(neurod1:EGFP) (green) and AC-αTub antibody staining (magenta). (C) Lightsheet projection of zebrafish stained for AC-αTub. Yellow arrow indicates vagal nerve innervation to the intestine. (D) neurod1:EGFP+ EECs (green) directly contact vagal sensory nerve fibers labeled with αTub (white). (E) Confocal image of the vagal sensory nucleus in zebrafish larvae hindbrain where vagal sensory neurons project. Vagal sensory nerve fibers are labeled with different fluorophores through Cre-brainbow recombination in Tg(neurod1:cre); Tg(βact2:Brainbow) zebrafish. The 3D zebrafish brain image was generated using mapzebrain (Kunst et al., 2019). (F) Confocal image of vagal sensory ganglia in Tg(neurod1:cre); Tg(βact2:Brainbow) zebrafish. Asterisk indicates posterior lateral line afferent nerve fibers. Blue arrowheads indicate three branches from vagal sensory ganglia that project to the hindbrain. (G) Confocal image demonstrates the EEC-vagal network in zebrafish intestine. EECs are labeled as magenta by neurod1:TagRFP and the vagal nerve is labeled green by isl1:EGFP. (H) EECs (neurod1+; magenta) directly contact vagal nerve fibers (isl1+; green) as indicated by yellow arrows. (I and J) In vivo calcium imaging of vagal sensory ganglia in zebrafish gavaged with PBS (I) or E. tarda (J). (K) Quantification of individual vagal sensory neuron Gcamp6f fluorescence intensity in E. tarda or PBS-gavaged zebrafish. (L–N) Confocal image of vagal ganglia (neurod1+; green) stained with pERK antibody (activated vagal sensory neurons; magenta) in WT (L,M) or EEC-ablated zebrafish (N) gavaged with PBS (L) or Trpa1 agonist AITC (M,N). (O–Q) Confocal projection of vagal ganglia stained with pERK antibody in WT (O,P) or EEC-ablated (Q) zebrafish gavaged with PBS (O) or E. tarda (P,Q). (R) Quantification of pERK+ vagal sensory neurons in WT or EEC-ablated zebrafish following PBS or AITC gavage. (S) Quantification of pERK+ vagal sensory neurons in WT or EEC-ablated zebrafish following PBS or E. tarda gavage. (T) Quantification of pERK+ vagal sensory neurons in WT or trpa1b−/− zebrafish following E. tarda gavage. One-way ANOVA with Tukey’s post-test was used in (R) and (S) and Student’s t test was used in (T). ∗p < 0.05; ∗∗p < 0.01; ∗∗∗p < 0.001; ∗∗∗∗p < 0.0001. |