
Fig. 1
- ID
- ZDB-FIG-210324-1
- Publication
- Ye et al., 2020 - Enteroendocrine cells sense bacterial tryptophan catabolites to activate enteric and vagal neuronal pathways
- Other Figures
- All Figure Page
- Back to All Figure Page
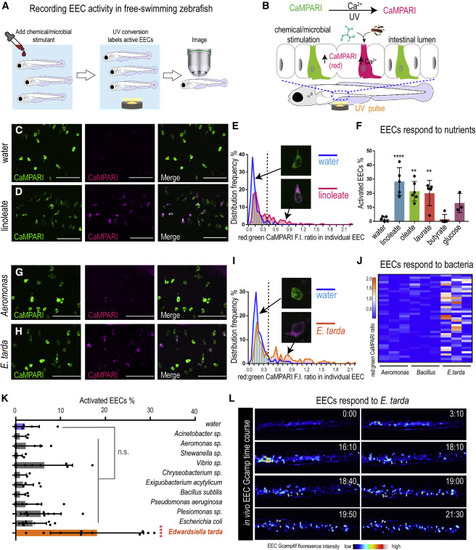
Figure 1. E. tarda activates zebrafish EECs in vivo (A) Experimental approach for measuring EEC activity in free-swimming zebrafish. (B) Method for recording EEC responses to chemical and microbial stimulants in the EEC-CaMPARI model. (C and D) Confocal projection of mid-intestinal EECs upon water (C, negative control) or linoleate (D) stimulation in Tg(neurod1:CaMPARI) following UV photoconversion. (E) Frequency distribution of EECs’ red:green CaMPARI fluorescence intensity ratio in water or linoleate-stimulated zebrafish. n = 177 for water group and n = 213 for linoleate group. (F) Percent EEC response in Tg(neurod1:CaMPARI) zebrafish. (G and H) Confocal projection of mid-intestinal EECs upon Aeromonas sp. (G) or E. tarda (H) stimulation in Tg(neurod1:CaMPARI) following UV photoconversion. (I) Frequency distribution of EECs’ red:green CaMPARI fluorescence intensity ratio in zebrafish treated with water or E. tarda. n = 117 for water group and n = 156 for E. tarda group. (J) Representative heatmap image showing Aeromonas sp., B. subtilis and E. tarda stimulated EEC red:green CaMPARI fluorescence ratio. (K) EEC activation in Tg(neurod1:CaMPARI) zebrafish stimulated with different bacterial strains. (L) Representative Tg(neurod1:Gcamp6f) zebrafish intestine stimulated with E. tarda. One-way ANOVA with Tukey’s post-test was used in (F) and (K). ∗p < 0.05; ∗∗p < 0.01; ∗∗∗p < 0.001; ∗∗∗∗p < 0.0001. |