FIGURE

Figure 2

ID
ZDB-FIG-210322-2
Publication
Kim et al., 2021 - Small compounds mimicking the adhesion molecule L1 improve recovery in a zebrafish demyelination model
Other Figures
All Figure Page
Back to All Figure Page
Figure 2

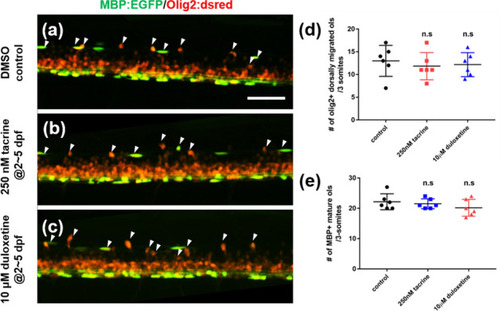
Tacrine and duloxetine show no effect on oligodendrocyte differentiation during development. All images are lateral views of the spinal cord of Tg(mbpa:egfp;olig2:dsred), anterior to the left and dorsal to the top. Larvae were exposed to 0.2% DMSO (a), 250 nM tacrine (b), and 10 μM duloxetine (c) during dpf 2 to 5. Arrowheads indicate olig2 + dorsally migrated oligodendrocytes. (d) Quantification of the number of olig2 + dorsally migrated oligodendrocytes per 3-somite area. Control: 22.16 ± 2.64, 250 nM tacrine: 21.5 ± 1.64, 10 μM duloxetine: 20.16 ± 2.79. (e) Quantification of the number of MBP + mature oligodendrocytes per 3-somite area. Control: 13 ± 3.41, 250 nM tacrine: 11.8 ± 2.99, 10 μM duloxetine: 12.17 ± 2.64. n = 6 per group; n.s., not significant. Scale bar, 50 μm.

Expression Data

Expression Detail
Antibody Labeling
Phenotype Data

Phenotype Detail
Acknowledgments
This image is the copyrighted work of the attributed author or publisher, and ZFIN has permission only to display this image to its users. Additional permissions should be obtained from the applicable author or publisher of the image. Full text @ Sci. Rep.