FIGURE SUMMARY
Title

Small compounds mimicking the adhesion molecule L1 improve recovery in a zebrafish demyelination model

Authors
Kim, S., Lee, D.W., Schachner, M., Park, H.C.
Source
Full text @ Sci. Rep.

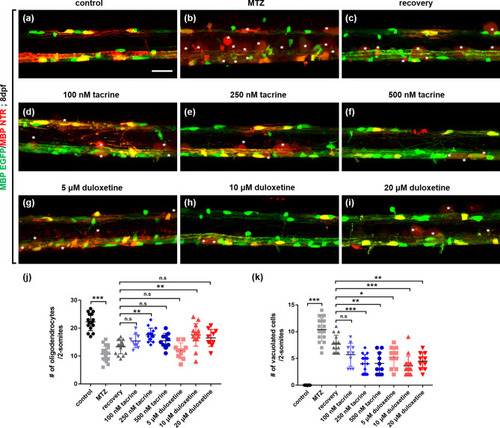
Effects of L1 mimetic compounds on the regeneration of oligodendrocytes in the spinal cord after oligodendrocyte ablation. All images are lateral views of the spinal cord of Tg(mbpa:gal4-vp16;uas:gfp;uas:NTR-mCherry) larvae at 8 days post-fertilization (dpf), anterior to the left and dorsal to the top. Fluorescence indicates MBP-positive oligodendrocytes and myelin sheaths in the spinal cord (a–i). White asterisks indicate debris of vacuolated oligodendrocytes. (j) Quantification of the number of oligodendrocytes per 2-somite area. Control: 22.27 ± 3.15, MTZ: 10.8 ± 2.90, recovery: 13.33 ± 2.55, 100 nM tacrine: 15.4 ± 2.41, 250 nM tacrine: 17.6 ± 2.41, 500 nM tacrine: 15.5 ± 1.64, 5 μM duloxetine: 11.9 ± 2.84, 10 μM duloxetine: 17.6 ± 4.05, 20 μM duloxetine: 16.5 ± 3.06. (k) Quantification of the number of vacuolated cells per 2-somite area. Control: 0, MTZ: 10.4 ± 2.36, recovery: 7.67 ± 1.68, 100 nM tacrine: 5.7 ± 2.16, 250 nM tacrine: 4 ± 1.73, 500 nM tacrine: 4.1 ± 2.02, 5 μM duloxetine: 5.2 ± 1.99, 10 μM duloxetine: 3.6 ± 1.84, 20 μM duloxetine: 4.5 ± 1.58. n = 15 for the control, recovery, 250-nM tacrine, and 10-μM duloxetine groups; n = 18 for the MTZ group; n = 10 for the 100- and 500-nM tacrine and 1-, and 20-μM duloxetine groups. ***p < 0.001; **p < 0.01; *p < 0.05; n.s., not significant. Scale bar, 25 μm.

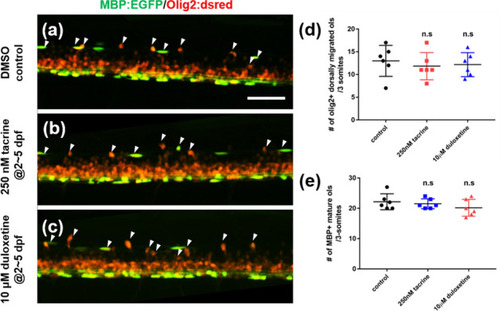
Tacrine and duloxetine show no effect on oligodendrocyte differentiation during development. All images are lateral views of the spinal cord of Tg(mbpa:egfp;olig2:dsred), anterior to the left and dorsal to the top. Larvae were exposed to 0.2% DMSO (a), 250 nM tacrine (b), and 10 μM duloxetine (c) during dpf 2 to 5. Arrowheads indicate olig2 + dorsally migrated oligodendrocytes. (d) Quantification of the number of olig2 + dorsally migrated oligodendrocytes per 3-somite area. Control: 22.16 ± 2.64, 250 nM tacrine: 21.5 ± 1.64, 10 μM duloxetine: 20.16 ± 2.79. (e) Quantification of the number of MBP + mature oligodendrocytes per 3-somite area. Control: 13 ± 3.41, 250 nM tacrine: 11.8 ± 2.99, 10 μM duloxetine: 12.17 ± 2.64. n = 6 per group; n.s., not significant. Scale bar, 50 μm.

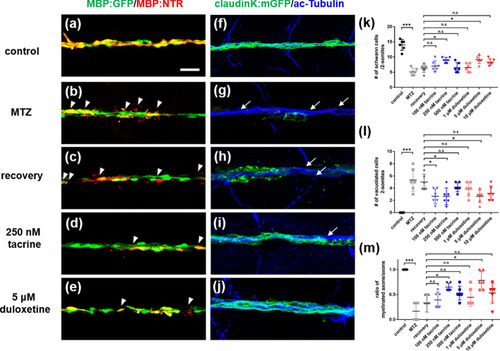
Tacrine and duloxetine enhance regeneration of Schwann cells in posterior lateral line axons after Schwann cell ablation. All images are lateral views of the posterior lateral line of (a–e) Tg(mbpa:gal4-vp16;uas:egfp;uas:NTR-mCherry), (f–j) Tg(claudinK:gal4-vp16;uas:megfp;uas:NTR-mCherry) larvae at 8 days post-fertilization (dpf). Anterior to the left and dorsal to the top. (a–e) GFP fluorescence indicates MBP-positive Schwann cells and red fluorescence indicates NTR + Schwann cells or vacuolated Schwann cells. Arrowheads indicate vacuolated cells. (f–j) GFP fluorescence indicates ClaudinK-positive myelin sheaths and blue fluorescence indicates acetylated tubulin-positive PLL axons. Arrows indicate demyelinated axons without GFP + myelin sheaths. (k) Quantification of the number of Schwann cells per 2-somite area. Control: 14 ± 1.79, MTZ: 5.16 ± 1.17, recovery: 6.33 ± 0.37, 100 nM tacrine: 7 ± 1.79, 250 nM tacrine: 9 ± 0.89, 500 nM tacrine: 6.5 ± 1.64, 1 μM duloxetine: 6.5 ± 1.33, 5 μM duloxetine: 9.17 ± 0.32, 10 μM duloxetine: 8.33 ± 1.03. (l) Quantification of the number of vacuolated cells per 2-somite area. Control: 0, MTZ: 5.33 ± 1.86, recovery: 5 ± 1.26, 100 nM tacrine: 2.67 ± 1.21, 250 nM tacrine: 2.67 ± 1.7, 500 nM tacrine: 4.17 ± 0.75, 1 μM duloxetine: 3.83 ± 1.17, 5 μM duloxetine: 2.27 ± 1.03, 10 μM duloxetine: 3.17 ± 1.17. (m) Ratio of the number of myelinated axons is indicated per total number of axons. Control: 1, MTZ: 0.165 ± 0.18, recovery: 0.33 ± 0.18, 100 nM tacrine: 0.39 ± 0.16, 250 nM tacrine: 0.65 ± 0.08, 500 nM tacrine: 0.53 ± 0.14, 1 μM duloxetine: 0.44 ± 0.18, 5 μM duloxetine: 0.78 ± 0.18, 10 μM duloxetine: 0.53 ± 0.2. n = 6 per group. The experiment was independently repeated three times. ***p < 0.001; **p < 0.01; *p < 0.05; n.s., not significant. Scale bar, 25 μm.

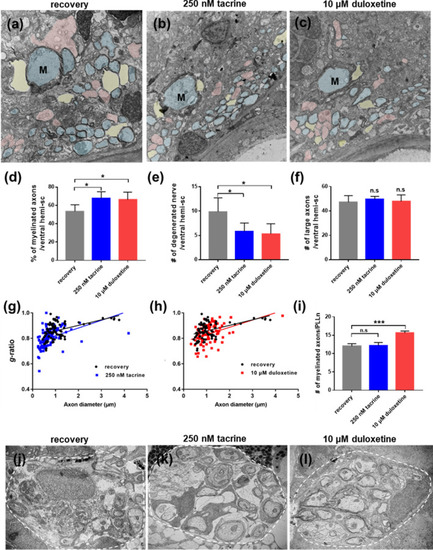
Tacrine and duloxetine promote remyelination after demyelination. Transmission electron microscopic images of transverse sections of the Tg(mbp:gal4-vp16;uas:gfp;uas:NTR-mCherry) larvae, with anterior to the left and dorsal to the top. (a–c) Representative images of ventral hemi-sections. M indicates Mauthner axon. Pseudo-colors were used to distinguish different degrees of myelination: blue indicates myelinated axons, pink indicates non-myelinated axons, and yellow indicates degenerated nerve structures. Scale bar, 2 μm. (d) Percentage of myelinated axons per ventral hemi-section. recovery: 53.4% ± 7.23, 250 nM tacrine: 69.2% ± 6.94, 10 μM duloxetine: 66.17% ± 8.23. (e) Quantification of the number of degenerated nerve structures per ventral hemi-section. Recovery: 9.86 ± 2.85; 250 nM tacrine: 5.83 ± 1.72; 10 μM duloxetine: 55.3 ± 2.07. (f) Quantification of the number of large caliber axons (> 1 μm) per ventral hemi-section. Recovery: 47.2 ± 5.36; 250 nM tacrine: 49.6 ± 2.30; 10 μM duloxetine: 47.8 ± 5.36. n = 5 for the recovery groups; n = 6 for the tacrine and duloxetine groups (g, h) Decreased g-ratio in myelinated axons in tacrine-treated larvae (blue line) and duloxetine-treated larvae (red line) compared to MTZ-treated larvae (black line); g-ratios: 0.86 ± 0.063; 250 nM tacrine: 0.81 ± 0.072, p < 0.001; 10 μM duloxetine: 0.4 ± 0.073, p < 0.05; n = 3. (i) Quantification of the number of myelinated axons per PLLn. Recovery: 12 ± 0.71, 250 nM tacrine: 12.2 ± 0.84, 10 μM duloxetine: 15.6 ± 0.55. (j–l) Representative sectioned images of PLL. Scale bar, 1 μm. ***p < 0.001; *p < 0.05; n.s., not significant.

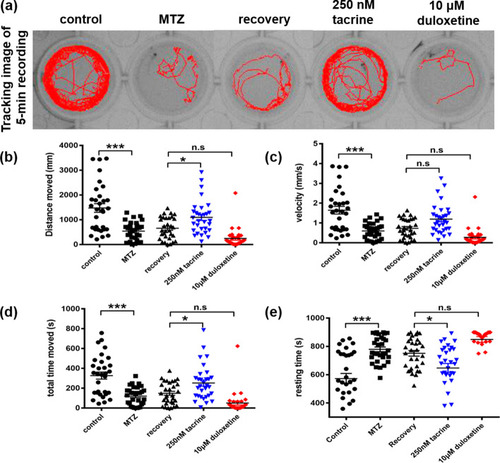
Tacrine, but not duloxetine, promotes restoration of locomotor activity. (a) Representative tracking image of a 5-min recording at 8 dpf. Quantification of (b) total distance moved (control: 1476.41 ± 975.90, MTZ: 539.10 ± 369.30, recovery: 655.05 ± 441.90, 250 nM tacrine: 1093.44 ± 670.50, 10 μM duloxetine: 243.87 ± 383.45), (c) velocity (control: 1.64 ± 1.09, MTZ: 0.60 ± 0.41, recovery: 0.73 ± 0.49, 250 nM tacrine: 1.19 ± 0.75, 10 μM duloxetine: 0.27 ± 0.42), (d) total movement time (control: 327.08 ± 200.34, MTZ: 120.81 ± 90.72, recovery: 148.80 ± 109.57, 250 nM tacrine: 252.45 ± 176.18, 10 μM duloxetine: 50.55 ± 113.43), and (e) total resting time (control: 572.91 ± 200.34, MTZ: 779.18 ± 90.72, recovery: 751.19 ± 109.57, 250 nM tacrine: 647.54 ± 176.18, 10 μM duloxetine: 549.44 ± 113.43) during 15-min recordings. The experiment was independently repeated three times (n = 31 per group). Error bars indicate mean ± standard deviation. ***p < 0.001; **p < 0.01; *p < 0.05; n.s., not significant.

Acknowledgments
This image is the copyrighted work of the attributed author or publisher, and ZFIN has permission only to display this image to its users. Additional permissions should be obtained from the applicable author or publisher of the image. Full text @ Sci. Rep.