
FIGURE
Figure 2
- ID
- ZDB-FIG-210301-30
- Publication
- Head et al., 2021 - Vitamin E Deficiency Disrupts Gene Expression Networks during Zebrafish Development
- Other Figures
- All Figure Page
- Back to All Figure Page
Figure 2
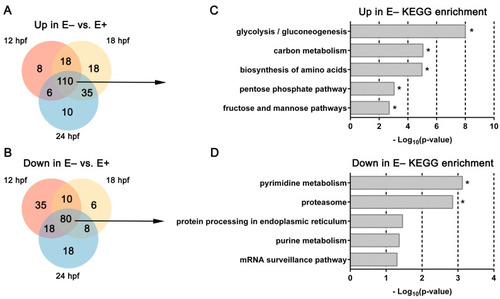
Venn diagrams and KEGG pathways enriched by over representation analysis of differentially expressed genes changed consistently over time. (A,B) Venn diagrams separating DE genes consistently (B) increased or (C) decreased in E– embryos relative to E+ embryos at each age. (C,D) KEGG pathways associated with DE genes (FDR < 0.1) consistently (C) increased or decreased (D) in E– embryos vs. E+ embryos at each time point (12, 18, and 24 hpf). * indicates significant FDR < 0.25. |
Expression Data
Expression Detail
Antibody Labeling
Phenotype Data
Phenotype Detail
Acknowledgments
This image is the copyrighted work of the attributed author or publisher, and
ZFIN has permission only to display this image to its users.
Additional permissions should be obtained from the applicable author or publisher of the image.
Full text @ Nutrients