
- Title
-
Vitamin E Deficiency Disrupts Gene Expression Networks during Zebrafish Development
- Authors
- Head, B., Ramsey, S.A., Kioussi, C., Tanguay, R.L., Traber, M.G.
- Source
- Full text @ Nutrients
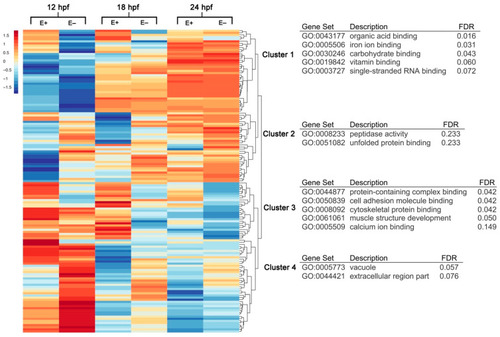
Hierarchical clustering and gene annotation of differentially expressed genes in E– and E+ embryos at 12, 18 and 24 hpf. Heatmap of all differentially expressed (DE) genes (n = 286, FDR < 0.1) clustered with z-score averages according to VitE status, age and gene with red color indicating greater expression relative to all-condition average and blue color indicating lower expression relative to all-condition average amongst all expression values (rows correspond to genes, columns correspond to conditions). Clusters within heatmap annotated by Gene Ontology (GO) terms organized by Benjamini–Hochberg False Discovery Rate (FDR). |
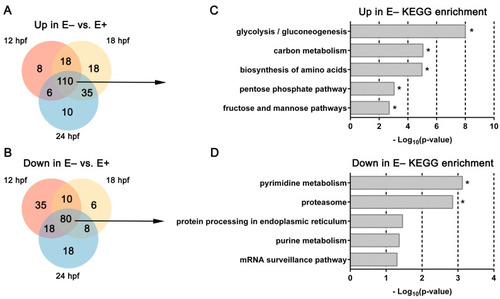
Venn diagrams and KEGG pathways enriched by over representation analysis of differentially expressed genes changed consistently over time. (A,B) Venn diagrams separating DE genes consistently (B) increased or (C) decreased in E– embryos relative to E+ embryos at each age. (C,D) KEGG pathways associated with DE genes (FDR < 0.1) consistently (C) increased or decreased (D) in E– embryos vs. E+ embryos at each time point (12, 18, and 24 hpf). * indicates significant FDR < 0.25. |

Gene ontology terms enriched by over representation analysis and gene set enrichment analysis of all differentially expressed genes. GO annotations associated with most highly DE genes (n = 286, FDR < 0.1, |log2(FC)| ≥ 1) enriched across all ages (12, 18 and 24 hpf) and Vitamin E (VitE) status by over-representation analysis. Terms are separated by (A) Biological Process, (B) Molecular Function and (C) Cellular Component. * indicates significant FDR < 0.25 with all enrichments shown considered significant. |

Gene ontology terms enriched by gene set enrichment analysis of all expressed genes. GO annotations associated with all genes (n = 22,796) pre-ranked, analyzed by time (12, 18, 24 hpf) and organized by normalized enrichment score. Top 10 significant (FDR < 0.25) GO terms are separated by expression at (A) 12 hpf, (B) 18 hpf and (C) 24 hpf. Approximate number of genes found enriched in each term indicated by dot size. Positive enrichment score indicates increased expression in E– relative to E+ embryos, negative enrichment score indicates decreased expression in E– relative to E+ embryos. Normalized enrichment score automatically computed with enrichment and adjusted p-value by WebGestalt. |

Mechanistic target of rapamycin (mTOR) signaling pathway disrupted in 24 hpf E– embryos. (A) E+ and E– embryos at 24 hpf metabolomic data acquired previously were integrated with gene expression profiles using MetaboAnalyst to generate network profiles. The mTOR signaling pathway was significantly enriched with both metabolites and genes expressed in 24 hpf E– embryos. Red boxes or circles represent increased, while green boxes represent reduced metabolite or gene expression, respectively, in E– relative to E+ embryos. (B) mTOR complex 1 (mTORC1)-associated proteins including Raptor, Rps6k, Eif2a and Eif4ebp1 were evaluated by activity determined by phosphorylation status in pooled protein extracts of rat liver (positive control), E+ and E– embryos (n = 30 embryos/pool) at 24 hpf. Phospho-protein (p-) to unphosphorylated protein ratio is calculated for the representative lanes shown. |