|
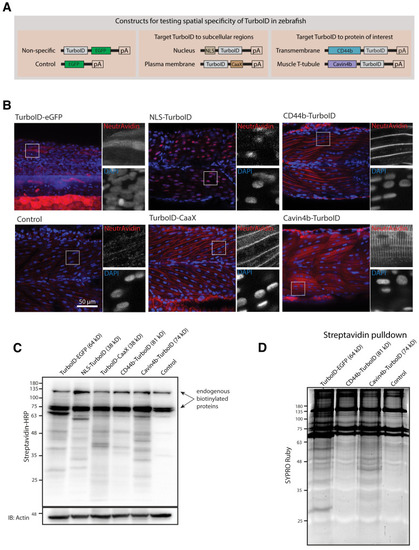
Spatial resolution of TurboID-catalysed biotinylation in zebrafish embryos.(A) Schematic representation of eGFP-, NLS-, CaaX-, CD44b-, and Cavin4b-tagged TurboID constructs for mRNA injection in zebrafish embryos. TurboID-eGFP was used as a positive control. (B) Representative images showing the distribution of biotinylated proteins in two dpf zebrafish embryos transiently expressing different TurboID constructs. Negative control fish were injected with eGFP only. Fish embryos were fixed and permeabilised before NeutrAvidin-DyLight staining for biotin and DAPI staining to indicate nuclei. Regions within the white box were magnified and shown in the gray scale for NeutrAvidin and DAPI staining in the right panel; n = 3. Scale bar represents 50 µm. (C) Streptavidin-HRP blots showing the ‘protein barcode’ produced by biotinylated proteins in fish embryo transiently expressing different TurboID constructs. Actin immunoblot served as a loading control. Each sample is a pool of 30 embryos. (D) SYPRO Ruby protein stain showing proteins isolated by streptavidin-pulldown. Approximately three hundred embryos transiently expressing each TurboID constructs were subjected to streptavidin-pulldown after biotin incubation and embryo lysis. For original western blot/gel images see Figure 2—source data 1.
|