
- Title
-
In vivo proteomic mapping through GFP-directed proximity-dependent biotin labelling in zebrafish
- Authors
- Xiong, Z., Lo, H.P., McMahon, K.A., Martel, N., Jones, A., Hill, M.M., Parton, R.G., Hall, T.E.
- Source
- Full text @ Elife
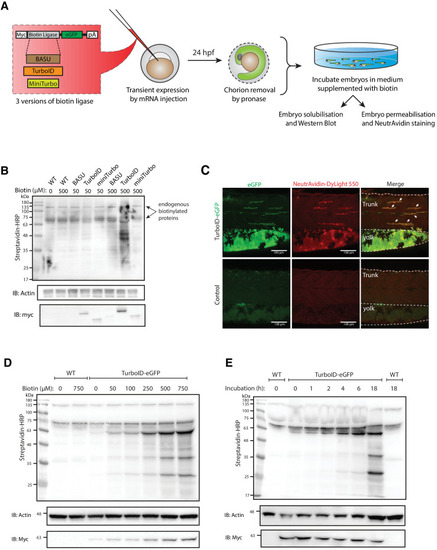
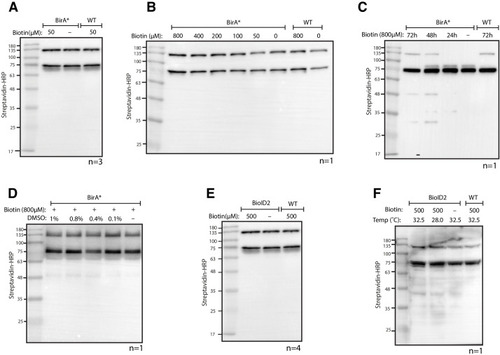
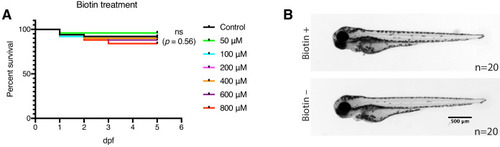
(A) A schematic overview of the workflow. The BASU/TurboID/MiniTurbo was transiently expressed in zebrafish embryos by RNA injection. Chorion-removed fish embryos with green fluorescence were selected for incubation in biotin supplemented embryo media for 18 hr. After biotin incubation, embryos were analysed by western blotting and immunofluorescence. (B) The streptavidin-HRP blot showing biotinylated proteins in two dpf zebrafish embryos expressing eGFP-tagged BASU, TurboID, and miniTurbo. Fish embryos were incubated in biotin concentrations of 50 or 500 μM biotin for 18 hr before embryo solubilisation and Western blot analysis. Actin immunoblot (IB:Actin) serves as a loading control; the anti-Myc immunoblot (IB:Myc) reflects the protein level of each biotin ligases; each sample is a pool of 30 embryos. (C) Representative images of NeutrAvidin staining of biotinylated proteins in 2 dpf zebrafish embryo transiently expressing TurboID-eGFP. Fish muscle and yolk were outlined with dashed lines. White arrows indicate muscle fibres expressing TurboID-eGFP. n = 6. Scale bar denotes 100 µm (D and E) Dependency of TurboID activity on biotin concentration and incubation time. Zebrafish embryos transiently expressing TurboID-eGFP were incubated with embryo media containing 0 to 750 μM biotin for 18 hr (D) or incubated with 500 μM biotin for 0 to 18 hr (E) before protein extraction and immunoblot analysis with streptavidin-HRP, anti-Actin and anti-Myc antibodies; each sample is a pool of 30 embryos. For immunoblots showing the biotinylation of BioID and BioID2 in zebrafish embryos see Figure 1—figure supplement 1. For biotin tolerance of zebrafish embryos see Figure 1—figure supplement 2. For original western blot images see Figure 1—source data 1. |
( |
( |
( |
( |
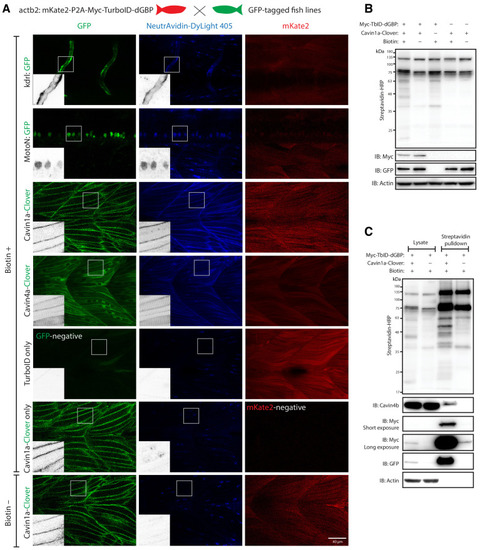
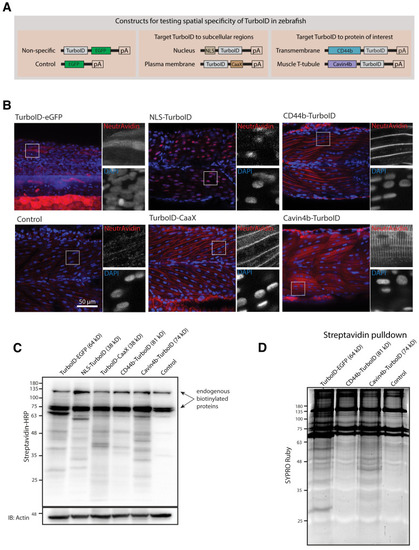
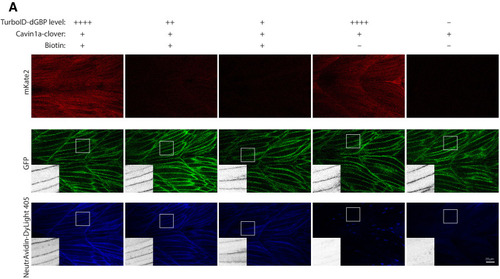
(A) Representative images of TurboID-dGBP catalysing GFP-dependent biotinylation in transgenic zebrafish embryos at 3 dpf. The TurboID-dGBP line was crossed with different GFP-tagged zebrafish lines: Cavin1a-Clover (plasma membrane), Cavin4a-Clover (sarcolemma and T-tubules), kdrl:eGFP (vasculature), and MotoN:eGFP (motor neurons). After biotin incubation, embryos were fixed, permeabilised, and stained with NeutrAvidin to visualise the biotinylated protein. mKate2 is a fluorescent indicator for expression of TurboID-dGBP. Controls were carried out by using siblings from the same clutch without GFP expression (TurboID only) and siblings without TurboID expression (Cavin1a-Clover only), as well as omitting biotin incubation. The scale bar denotes 40 µm; n = 3. (B) Western blot analysis showing the biotinylated proteins in 3 dpf zebrafish embryos from TurboID-dGBP outcrossing with Cavin1a-Clover line. Each sample is a pool of 30 embryos. (C) Western blot analysis of fish lysates and streptavidin pulldown with embryos from TurboID-dGBP line outcrossing with Cavin1a-Clover line. Each pulldown sample is a pool of 200 embryos. For confocal images comparing the biotin labelling specificity in zebrafish embryos with different expression level of TurboID-dGBP see Figure 4—figure supplement 1. For table summarising proteins identified in control embryos expressing only TurboID-dGBP, see Supplementary file 3. For original western blot images see Figure 4—source data 1. |
( |
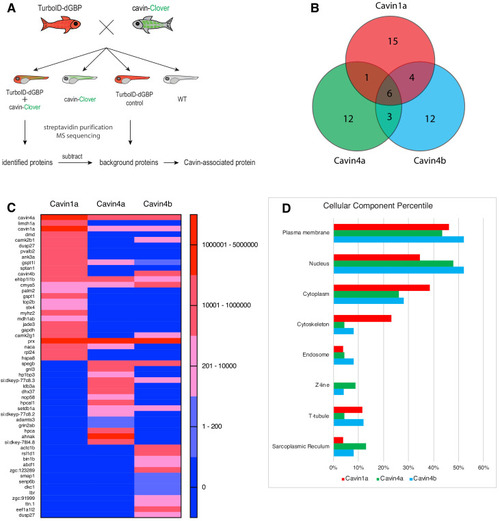
(A) A schematic overview of applying TurboID-dGBP fish to identify cavin-associated proteins. The TurboID-dGBP zebrafish was crossed with Clover-tagged cavin fish lines. The embryos carrying both transgenes were selected for subsequent biotin incubation and biotin affinity purification coupled MS sequencing. Identified proteins were refined by subtracting proteins identified in control embryos expressing only TurboID-dGBP. (B) Venn diagram showing the overlap of identified proteins in Cavin1a, Cavin4a, and Cavin4b samples. (C) Heatmap showing relative abundance of identified proteins based on normalised MS2Count in Cavin1a, Cavin4a, and Cavin4b proteomes. (D) Bar graph showing the distribution of proteins at subcellular level. The cellular component information was curated from Uniport database and literature. For table summarising all identified and enriched proteins, see Supplementary file 1 – Tables 1-3. For table annotating all identified and enriched protein with subcellular localisation and functions, see Supplementary file 1 – Table 4. For table showing all identified peptides in Cavin1a sample and sibling control sample see Supplementary file 2 – Tables 1-2. For protein identification report generated by ProteinPilot, see Figure 5—source datas 1–6. |
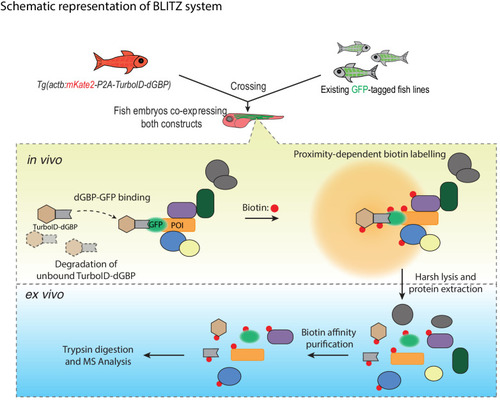
The TurboID-dGBP lines can be crossed with existing GFP-tagged lines. In the embryos carrying both transgenes, the binding between dGBP and GFP stabilise TurboID-dGBP, which leads to proximity biotinylation around the GFP-tagged POIs. The unbound TurboID-dGBP will be rapidly degraded by the ubiquitin proteasome system, which minimises non-specific labelling when dGBP-GFP binding saturates, as well as achieving tissue specificity by averting labelling in cells/tissues that do not express GFP. The biotin-labelled proteins can be isolated by biotin affinity purification and identified by MS analysis. |