FIGURE
Figure 6 - figure supplement 2
- ID
-
ZDB-FIG-210215-63
- Publication
-
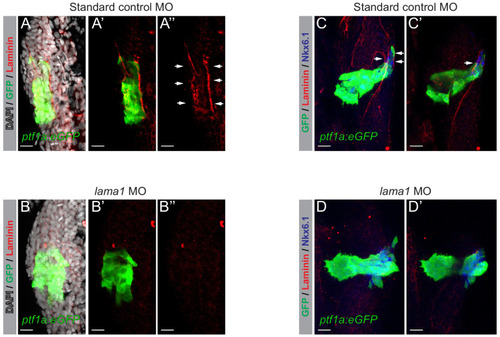
Geusz et al., 2021 -
Pancreatic progenitor epigenome maps prioritize type 2 diabetes risk genes with roles in development
- Other Figures
-
- All Figure Page
-
Back to All Figure Page
Expression Data
|
Antibody:
|
|
|
Fish:
|
|
|
Knockdown Reagent:
|
|
|
Anatomical Term:
|
|
|
Stage Range:
|
Prim-15
to High-pec
|
Acknowledgments
This image is the copyrighted work of the attributed author or publisher, and
ZFIN has permission only to display this image to its users.
Additional permissions should be obtained from the applicable author or publisher of the image.
Full text @ Elife