|
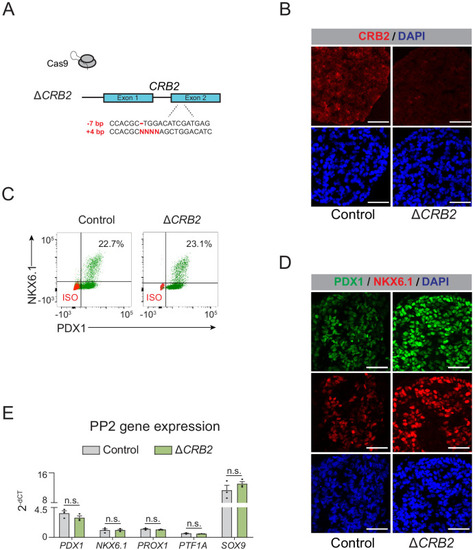
Deletion of <italic>CRB2</italic> does not affect pancreatic lineage specification.(A) Schematic illustrating CRISPR-Cas9-mediated deletion strategy of CRB2 to generate ∆CRB2 hESC clonal line. (B) Immunofluorescent staining for CRB2 in control and ∆CRB2 PP2 cells (representative images, n = 2 independent slides). Scale bar, 50 μm. (C) Flow cytometry analysis for NKX6.1 and PDX1 comparing control and ∆CRB2 PP2 cells. Isotype control (ISO) for each antibody is shown in red and target protein staining in green. Percentage of cells expressing each protein is indicated. (D) Immunofluorescent staining for NKX6.1 and PDX1 in control and ∆CRB2 PP2 cells (representative images, n = 2 independent slides). Scale bar, 50 μm. (E) mRNA expression of pancreatic transcription factors determined by qPCR in control and ∆CRB2 PP2 cells. Data are shown as mean ± S.E.M. (n = 3 replicates from independent differentiations. n = 3 technical replicates for each sample; p=0.241, 0.971, 0.397, 0.374, and 0.311 for comparisons of PDX1, NKX6.1, PROX1, PTF1A, and SOX9 expression in control compared to ∆CRB2 PP2 cells, respectively; student’s t-test, two sided; n.s., not significant). Each plotted point represents the average of technical replicates for each differentiation.
|