
Fig. 2 supplement 2
- ID
- ZDB-FIG-210126-5
- Publication
- Cayuso et al., 2019 - Actomyosin regulation by Eph receptor signaling couples boundary cell formation to border sharpness
- Other Figures
- All Figure Page
- Back to All Figure Page
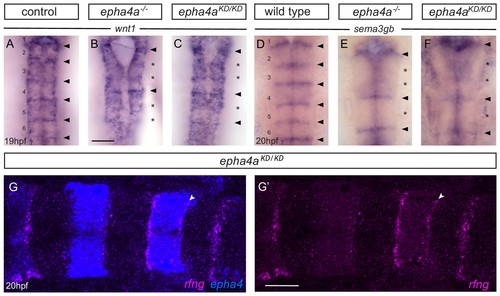
Boundary marker expression in epha4 mutants. (A–C) Expression of wnt1 is reduced at specific hindbrain boundaries in epha4-/- (B; 13/13) and epha4KD (C; 13/15) mutants compared to controls (A; 17/18). Dorsal expression of wnt1 is not changed in the mutants. (D–F) sema3gb expression is reduced at specific boundaries in epha4-/- (E; 14/14) and epha4KD (F; 17/17) mutants compared to controls (D; 17/17). Arrowheads indicate normal boundary expression of wnt1 or sema3gb, while stars indicate reduction or absence of boundary marker expression. Dorsal views, anterior to the top. (G, G’) HCR staining for rfng and epha4a in epha4KD mutants reveals that remaining rfng expression occurs in epha4-expressing cells at the r5/r6 boundary (white arrowhead; 20/20). Dorsal view, anterior to the left. Scale bar: 50 μm. |