
Fig. 2 supplement 1
- ID
- ZDB-FIG-210126-4
- Publication
- Cayuso et al., 2019 - Actomyosin regulation by Eph receptor signaling couples boundary cell formation to border sharpness
- Other Figures
- All Figure Page
- Back to All Figure Page
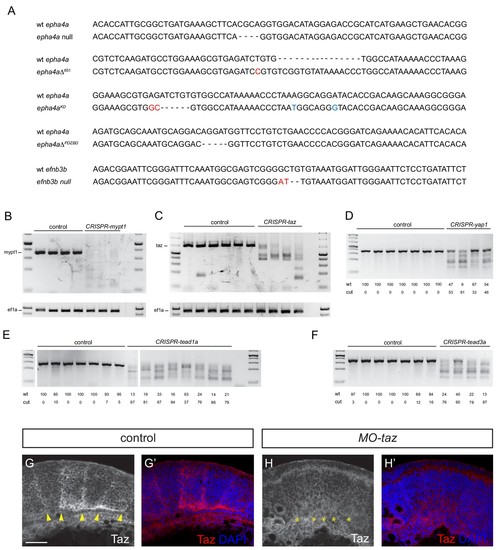
Validation of knockout and knockdown reagents and mutants. (A) DNA sequence of the epha4a and efnb3b mutants. Nucleotides in red indicate small insertions or substitutions introduced at target sites; nucleotides in blue indicate residues that have been introduced by insertion of a template DNA, including the A to T transversion causing the kinase loss-of-function. (B, C) PCR of region targeted by multiple gRNAs against mypt1 (B) and taz (C) suggest that large deletions occur in injected embryos. (D–F) T7 endonuclease I digestion of PCR products of regions targeted in yap1 (D), tead1a (E) and tead3a (F), with quantitation of undigested (wt) and digested products. Cut bands in DNA from some uninjected embryos in E and F may reflect the presence of SNPs. Five embryos were pooled for each PCR or digestion. (G, H) Taz staining in boundaries is lost after taz knockdown. Lateral views. Arrowheads indicate Taz+ boundary position. Asterisks indicate Taz- boundary position. Scale bar: 50 μm. |