FIGURE

FIGURE 4

ID
ZDB-FIG-201230-4
Publication
Delbaere et al., 2020 - b3galt6 Knock-Out Zebrafish Recapitulate β3GalT6-Deficiency Disorders in Human and Reveal a Trisaccharide Proteoglycan Linkage Region
Other Figures
All Figure Page
Back to All Figure Page
FIGURE 4

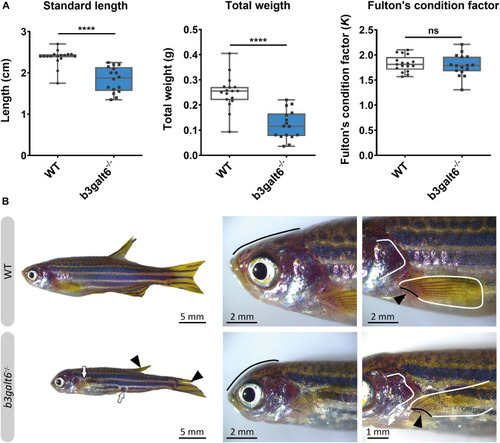
Characterization of the external phenotype of adult b3galt6–/– zebrafish. (A)b3galt6–/– zebrafish (n = 16) had a significantly shorter standard length (SL) compared to their WT siblings (n = 17). The weight (W) was significantly lower in the mutant zebrafish. The Fulton’s condition factor [K = 100*(W/SL3)] was not significantly different between b3galt6–/– zebrafish and WT siblings. Data are expressed as box plots with min-to-max whiskers on which each individual data point is plotted. An unpaired t-test with Welch’s correction was used to determine significance. ****P < 0.0001, ns: not significant. (B) Adult b3galt6–/– zebrafish exhibit morphological abnormalities compared to their WT siblings; b3galt6–/– zebrafish display interruptions of the blue horizontal stripes (white arrows), smaller fins (arrowhead), aberrations of the head shape (black line), of the shape of the opercular apparatus (white line indicates the posterior edge) and of the pectoral fin (black line and arrow indicate the fin rays at the base of the fin, white line shows the outline of the fin).

Expression Data

Expression Detail
Antibody Labeling
Phenotype Data
Fish:
Observed In:
Stage: Adult

Phenotype Detail
Acknowledgments
This image is the copyrighted work of the attributed author or publisher, and ZFIN has permission only to display this image to its users. Additional permissions should be obtained from the applicable author or publisher of the image. Full text @ Front Cell Dev Biol