|
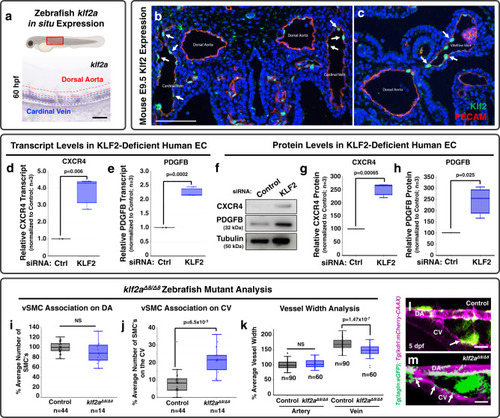
KLF2 is a negative regulator of chemokine signaling and PDGFB during early development.a Top: Schematic diagram of a zebrafish larva with the red box highlighting the area imaged below. Bottom: Representative whole mount in situ hybridization (WISH) image of a 60 hpf zebrafish probed for klf2a. Red dashed lines indicate the dorsal aorta; blue dashed lines indicate the cardinal vein. b, c Fluorescent images of transverse sections through E9.5 mice: IHC for GFP was done to amplify signal from a Klf2-GFP knockin allele where the GFP is fused to the N-terminus of Klf2 (Klf2; green) and for platelet endothelial cell adhesion molecule-1 (PECAM) to mark the endothelium (red). Nuclei are labeled with DAPI (blue). Arrows highlight Klf2-positive endothelial nuclei in the cardinal vein (b) and vitelline vein (c)32,84. d, e Quantitative qPCR measurement of CXCR4 (d) and PDGFB (e) transcript levels in HUVEC cells cultured in vitro as a confluent cell monolayer and treated with either control (black columns) or KLF2 (blue columns) siRNA. Values are expressed as a percentage of control and are representative of three individual experiments. Samples are generated by pooling 20 individual embryos per condition. f–h Representative western blot images of CXCR4 and PDGFB protein levels (f), and quantification of relative CXCR4 (g) and PDGFB protein levels (h) from HUVEC cells cultured in vitro in a confluent cell monolayer and treated with either control or KLF2 siRNA. Values in g, h are averaged from three individual experiments and expressed as a percentage of control. I, J Quantification of vSMC number associated with the dorsal aorta (i) or cardinal vein (j) in the mid-trunk of 5 dpf control wild type/heterozygous siblings (black columns; n = 44 (i, j)) or klf2aΔ8/Δ8 mutant (blue columns; n = 14 (i, j)) animals. Values are averaged from data collected from three separate experiments and are expressed as a percentage of the control sibling average. k Quantification of dorsal aorta (DA, left columns) and cardinal vein (CV, right columns) width in the mid-trunk of 5 dpf control sibling (black columns; n = 90) or klf2aΔ8/Δ8 mutant (blue columns; n = 60) animals. Values are averaged from data collected from three separate experiments and are expressed as a percentage of the average artery width in the control siblings. l, m Confocal images of the anterior trunk of 5 dpf Tg(tagln:eGFP), Tg(kdrl:mCherry-CAAX) control sibling (l) and klf2aΔ8/Δ8 mutant (m) zebrafish embryos with eGFP-positive vSMCs (green) and mCherry-CAAX-positive endothelial cells (magenta). Arrows point to vSMCs associated with the CV in control versus klf2aΔ8/Δ8 mutants. Scale bars = 300 µm (panels b, c) and 75 µm (panels l, m). Box plots are graphed showing the median versus the first and third quartiles of the data (the middle, top, and bottom lines of the box, respectively). The whiskers demonstrate the spread of data within 1.5x above and below the interquartile range. All data points are shown as individual dots, with outliers shown above or below the whiskers. P-values are indicated above statistically significant datasets. Statistics in panels d, e were generated via two-way ANOVA and panel k were run using two-way ANOVA; all other panels employ student’s t-tests to calculate the P-values.
|