|
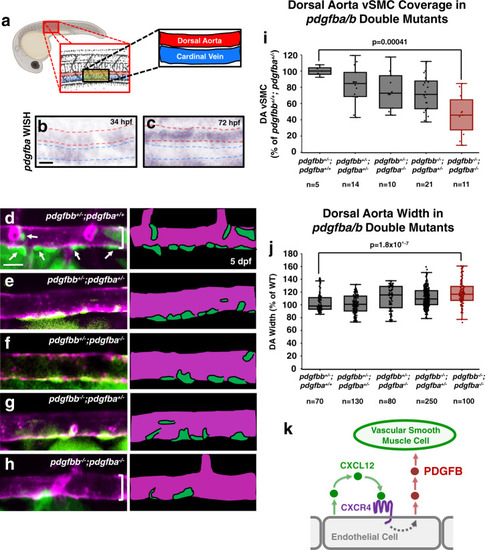
<italic>pdgfb</italic>-mediated signaling regulates vSMC association with arteries.a Schematic representation of the area imaged for in situ hybridization analysis, demonstrating the location of the dorsal aorta (DA) and cardinal vein (CV) within these images. b, c Whole mount in situ hybridization (WISH) images of pdgfba transcript (purple) in 34 hpf (b) and 72 hpf (c) zebrafish. Red dashed lines outline the dorsal aorta, blue dashed lines outline the cardinal vein. An expanded time course including these images can be found in Supplemental Fig. 1. d–h Confocal images (left) and schematic representations (right) of the dorsal aorta (DA) in the anterior trunk of 5 dpf Tg(tagln:eGFP), Tg(kdrl:mCherry-CAAX) double-transgenic pdgfbb+/−, pdgfba+/+ sibling (d); pdgfbb+/−, pdgfba+/− (e); pdgfbb+/−, pdgfba−/− (f); pdgfbb−/−, pdgfba+/− (g); or, pdgfbb−/−, pdgfba−/− double homozygous mutant (h) zebrafish expressing eGFP in vSMCs (green) and mCherry-CAAX in the endothelium (magenta). The schematic representations demonstrate what were counted as cells in the adjacent panels. Scale bars = 75 µm. i, j Quantification of the number of associated vSMCs (i) and width (j) of the dorsal aorta in 5 dpf Tg(tagln:eGFP), Tg(kdrl:mCherry-CAAX) double-transgenic zebrafish carrying different combinations of heterozygous or homozygous pdgfba and pdgfbb mutants. Values are averaged from three individual experiments and expressed as a percentage of the pdgfbb+/−, pdgfba+/+ control. Total n number per condition is shown below each sample in the graphs. k Schematic diagram illustrating the proposed model for endothelial-autonomous chemokine signaling driving increased endothelial PDGFB ligand production, and thereby indirectly promoting vSMC acquisition by arteries. Box plots are graphed showing the median versus the first and third quartiles of the data (the middle, top, and bottom lines of the box, respectively). The whiskers demonstrate the spread of data within 1.5x above and below the interquartile range. All data points are shown as individual dots, with outliers shown above or below the whiskers. P-values are indicated above statistically significant datasets and were calculated using one-way ANOVA.
|