|
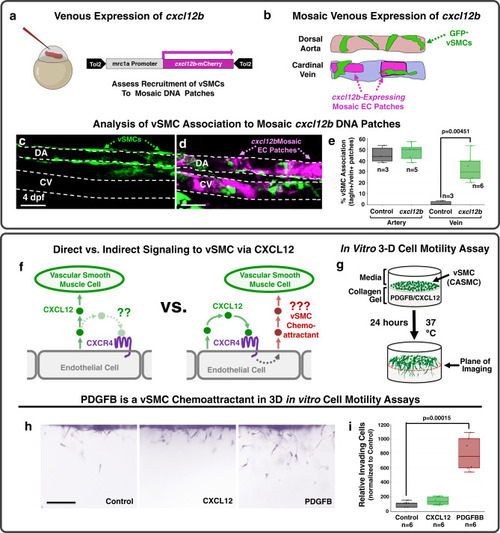
<italic>cxcl12b</italic> promotes vSMC association without serving as a direct chemoattractant.a, b Schematic diagrams illustrating the experimental design for using the mrc1a promoter to drive ectopic mosaic expression of cxcl12b in veins. a A Tol2(mrc1a:cxcl12b-2a-mCherry) DNA construct co-translationally expressing cxcl12b and mCherry under the control of the mrc1a promoter is injected into Tg(tagln:eGFP) transgenic zebrafish embryos at the 1 cell stage. b At 4 dpf tol2(mrc1a:cxcl12b-2a-mCherry)-injected zebrafish larvae are analyzed for vSMC (eGFP) association at sites of mCherry (i.e., cxcl12b) expression in the dorsal aorta and cardinal vein. c, d Representative confocal images of the mid-trunk of 4 dpf Tg(tagln:eGFP) transgenic larvae injected with either control Tol2(mrc1a) “empty vector” (c) or Tol2(mrc1a:cxcl12b-2a-mCherry) (d). eGFP-expressing vSMCs are shown in green, cxcl12b-2a-mCherry expression in dorsal aorta (DA) or cardinal vein (CV) endothelium is shown in magenta. e Quantification of eGFP-positive vSMC associated with the dorsal aorta (DA) or cardinal vein (CV) in 4 dpf Tg(tagln:eGFP) transgenic zebrafish injected with either control Tol2(mrc1a) “empty vector” (black columns; n = 3 for artery and vein) or Tol2(mrc1a:cxcl12b-2a-mCherry) (green columns; n = 5 artery, n = 6 vein), showing strongly increased association of vSMCs with the cardinal vein. f Schematic diagrams showing potential models for direct (left) versus indirect (right) mechanisms for promoting arterial recruitment of vSMC via CXCL12. g Schematic diagram illustrating the 3-D coronary artery smooth muscle cell (CASMC) motility assay. CXCL12, PDGFB, or nothing (control) is placed within the collagen gel to determine if CASMCs migrate towards these potential chemoattractants. h Representative lateral images of 3-D collagen gels showing CASMCs within the collagen matrix for each gel condition. i Quantification of the relative number of CASMCs invading the collagen gel. The control is set to 100% and the CXCL12 and PDGFB conditions normalized to this level of invasion. Scale bars = 75 µm (panels c, d), 200 µm (panel h); n = 6. Box plots are graphed showing the median versus the first and third quartiles of the data (the middle, top, and bottom lines of the box, respectively). The whiskers demonstrate the spread of data within 1.5x above and below the interquartile range. All data points are shown as individual dots, with outliers shown above or below the whiskers. P-values are indicated above statistically significant datasets. Statistics in panels e and i were run using two-way ANOVA to calculate P-values.
|