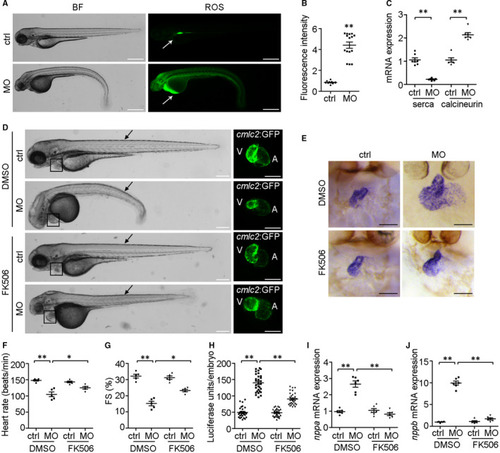
Calcium signalling is involved in ndufa7‐depletion induced cardiac hypertrophy. (A) WT zebrafish embryos were injected with MO at 1‐cell stage and stained for ROS using 2’,7’‐dichlorofluorescin diacetate. Arrows indicate the ROS staining in the heart. Scale bar, 500 μm. (B) Experiments were performed as in (A), and the intensity of ROS level was analysed. **P < .01 compared with control MO group. (C) cmlc2::GFP embryos were injected with ndufa7 MO or control MO at 1‐cell stage, and RNA was then extracted from harvested embryo hearts at 3 dpf for RT‐qPCR. The expression level of serca and calcineurin were examined. The experiments were performed in triplicate, with 60 individuals per condition. Statistical test: Student's t test. **P < .01 compared with control MO group. (D) MO microinjections were performed at 1‐cell stage, 0.5% DMSO (vehicle control) or FK506 (in 0.5% DMSO) were added to embryo water at 21 hpf and cardiac fluorescent imaging was performed on cmlc2::GFP embryos at 3 dpf. Black arrow indicates somite defects, and black box shows cardiac defects. Scale bar, 300 μm in bright field, 150 μm in GFP field. The experiments were performed in triplicate, processing 30 embryos per condition. (E) Wild‐type zebrafish embryos were injected with MO at 1‐cell stage, treated with DMSO or FK506 at 21 hpf, and then subjected to whole‐mount ISH with riboprobes against cmlc2 at 3 dpf. Dorsal views of endogenous cmlc2 mRNA expression pattern were observed. Scale bar, 75 μm. (F‐G) Experiments were performed as in (D), heart rate and fractional shortening (FS) of the ventricular chamber were measured. **P < .01, *P < .05 compared with controls. (H) nppb::F‐luc embryos were injected with ndufa7 splice‐blocking MO or control MO at 1‐cell stage, treated with FK506 or 0.5% DMSO at 21 hpf, and collected at 3 dpf for the luciferase assay. The experiments were performed in triplicate, with 50 individuals per condition. Statistical test: Student's t test. **P < .01 compared with control MO group, n = 30 measurements per condition. (I‐J) cmlc2::GFP embryos were injected with ndufa7 MO or control MO at 1‐cell stage, and treated with 0.5% DMSO or FK506. RNA was extracted from harvested embryo hearts at 3 dpf to examine the mRNA expression level of nppa and nppb. The experiments were performed in triplicate, with 60 individuals per condition. Statistical test: Student's t test. **P < .01 compared with control MO group or DMSO vehicle group, n = 6 measurements per condition
|
