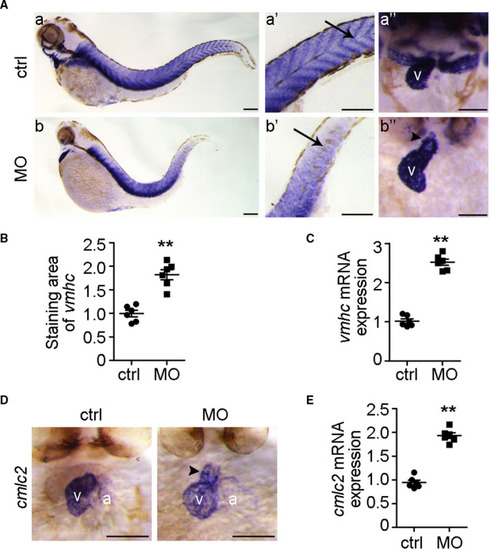
ndufa7 inhibition contributes to cardiac structural defects. (A) Wild‐type zebrafish embryos were injected with ndufa7 MO or control MO at 1‐cell stage and then subjected to whole‐mount ISH with riboprobes against vmhc at 3 dpf. Lateral views of endogenous vmhc mRNA expression pattern were visualized under the microscope (a, b). The expression pattern of vmhc mRNA transcripts was expressed in the trunk muscle (a’, b’), as well as in the ventricle under the dorsal views (a’’, b’’). Arrows and arrowheads indicate the muscle structure and outflow track, respectively, and v represents ventricle. Scale bar, 75 μm. The experiments were performed in triplicate, with 20 individuals per condition. (B) Experiments were performed as in (A), and the staining area of vmhc in the heart was examined using ImageJ software. Statistical test: Student's t test. **P < .01 compared with control MO group, n = 6 measurements per condition. (C) cmlc2::GFP embryos were injected with ndufa7 MO or control MO at 1‐cell stage, and RNA was then extracted from harvested embryo hearts at 3 dpf. The expression level of vmhc in the hearts was examined by RT‐qPCR. Statistical test: Student's t test. **P < .01 compared with control MO group, n = 6 measurements per condition. (D) Wild‐type zebrafish embryos were injected with ndufa7 MO or control MO at 1‐cell stage, and then subjected to whole‐mount ISH with riboprobes against cmlc2 at 3 dpf. Dorsal views of endogenous cmlc2 mRNA expression pattern were observed. Arrowheads indicate the outflow track, v represents ventricle and a represents atrium. Scale bar, 75 μm. The experiments were performed in triplicate, with 20 individuals per condition. (E) cmlc2::GFP embryos were injected with ndufa7 MO or control MO at 1‐cell stage, and RNA was then extracted from embryo hearts at 3 dpf for RT‐qPCR. Statistical test: Student's t test. *P < .05 compared with control MO group, n = 6 measurements per condition
|
